On This Page:
- Background
- Measure
- Healthy People 2030 Target
- Data Source
- Trends and Most Recent Estimates
- Related Cancers
- Additional Information
Background
Cigarette smoking is the leading preventable cause of disease and death in the United States. Smoking causes cancers of the lung, esophagus, larynx, mouth, throat, kidney, bladder, liver, pancreas, stomach, cervix, colon and rectum, as well as acute myeloid leukemia. Altogether, smoking causes approximately 30 percent of all U.S. cancer deaths each year. The American Cancer Society estimated that, in 2022, almost 182,808 of the estimated 609,360 cancer-related deaths will be caused by cigarette smoking.
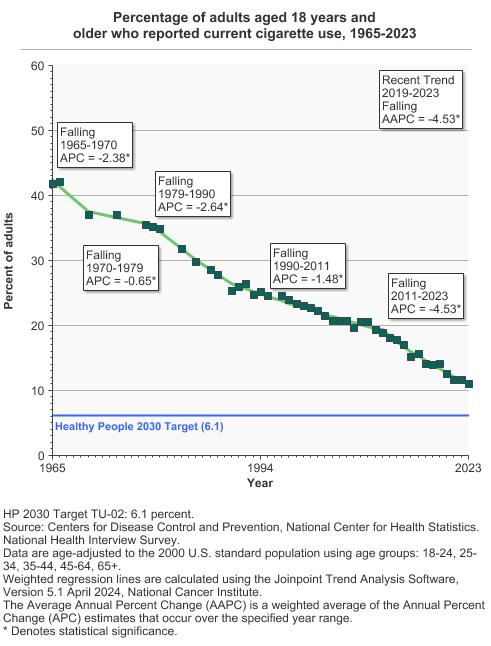
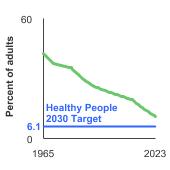
The prevalence of adult cigarette smoking in the U.S. has steadily declined since the first Surgeon General’s Report on the harms of smoking was published in 1964, when smoking prevalence was 42 percent. While the prevalence of daily smoking has dropped over time, and the average number of cigarettes smoked per day among those who smoke daily has decreased, the prevalence of nondaily smoking has remained comparatively stable regardless of the number of cigarettes smoked on a given day. Many studies show that there is no safe level of smoking. For example, individuals who smoke even a few cigarettes per month over their lifetime are at a higher risk of smoking-related death than those who have never smoked, according to research published in the journal JAMA Network Open.
Moreover, while the prevalence of cigarette smoking has declined overall, there remain notable disparities between different subpopulations defined by income, level of educational attainment, race and ethnicity, and other sociodemographic characteristics. For example, according to 2022 National Health Interview Survey (NHIS) data, 19.3% of American Indian or Alaska Native individuals reported current cigarette use, compared to only 12.7% among non-Hispanic White individuals. Another area where disparities remain is among people who smoke menthol cigarettes. Although the overall prevalence of menthol cigarette smoking has declined over time among U.S. adults, prevalence of non-menthol cigarette smoking has declined more quickly, and, subsequently, menthol use among people who smoke has continued to increase over time. Young adults, women and non-Hispanic Black individuals are more likely to smoke menthol cigarettes compared to their respective counterparts.
Other tobacco products such as cigars, smokeless tobacco, and e-cigarettes are also used by U.S. adults, and many individuals report using multiple products.
A cigar is defined as a roll of tobacco wrapped in leaf tobacco or in a substance that contains tobacco (whereas a cigarette is defined as a roll of tobacco wrapped most often in paper or some other non-tobacco substance). There are three major types of cigars currently sold in the U.S. – large cigars, cigarillos, and little cigars. Cigarillos are short (3-4 inches), narrow cigars that contain approximately 3 grams of tobacco and typically do not include a filter. Little cigars are about the same size as a cigarette and often include a filter. The marketplace of cigar products in the U.S. has recently been characterized by increasing product diversity, and marketing of these products has been targeted to specific population groups, including urban Black adults. Cigars, especially little cigars and cigarillos, come in a variety of flavors, including menthol, fruit and alcohol flavors, such as grape and wine, which appeal to adolescents and young adults.
Like cigarette smoke, cigar smoke contains toxic and carcinogenic compounds that are harmful to both people who smoke and people exposed to secondhand smoke. Cigar smoking causes oral cavity cancers (cancers of the lip, tongue, mouth, and throat) and cancers of the larynx (voice box), esophagus, and lung. Gum disease and tooth loss are also linked to cigar smoking, and people who smoke cigars heavily or inhale deeply may further be at increased risk of developing coronary heart disease. Smoking cigars heavily also increases the risk for serious lung diseases that cause difficulty breathing, such as emphysema and chronic bronchitis. These diseases can, in turn, be risk factors for lung cancer.
Smokeless tobacco is also known as chewing tobacco, spit tobacco, snuff, dip, or snus. Snuff is a finely cut or powdered tobacco that is either placed between the cheek and gum, or sniffed through the nose, respectively. Some moist snuff and all snus come in tea bag-like pouches. Chewing tobacco is used by putting a wad (loose leaves, plug, or twist) of tobacco inside the cheek. The prevalence of smokeless tobacco use tends to be higher among men, compared with women, and residents of rural areas, compared with residents of urban areas.
Chewing tobacco and snuff contain at least 28 cancer-causing agents. Use of smokeless tobacco causes oral, esophageal, and pancreatic cancer. Smokeless tobacco also causes serious oral health problems, including gum disease, other non-cancerous oral lesions, and tooth loss, and increases the risk of heart disease.
E-cigarettes (also known as vapes or Electronic Nicotine Delivery Systems (ENDS)) are battery-powered devices that convert a liquid (“e-liquid”) into an aerosol. E-liquids typically contain nicotine, flavorings, vegetable glycerin, propylene glycol and other chemicals. In addition to nicotine, e-cigarette aerosol may contain heavy metals, volatile organic compounds, and fine and ultrafine particles that can be inhaled deeply into the lungs by both users and by-standers.
E-cigarette use among adults may potentially reduce the health risks associated with conventional cigarette smoking if users switch completely to e-cigarettes. However, a large percentage of U.S. adults who use e-cigarettes also smoke conventional cigarettes and are at continued risk for exposure to their toxic and carcinogenic compounds, and subsequent smoking-related morbidity and mortality. Furthermore, almost a quarter of those who use e-cigarettes report never having smoked, and the majority of this group is 18-24 years old. Exposure to nicotine may harm normal brain development, which continues until about age 25.
Measure
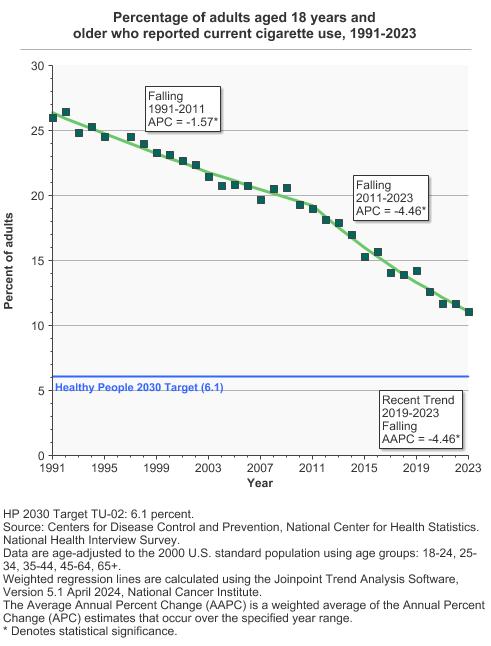
Cigarettes: Percentage of adults aged 18 years and older who had smoked at least 100 cigarettes in their lifetime and, at the time of the interview, smoked cigarettes every day or some days.
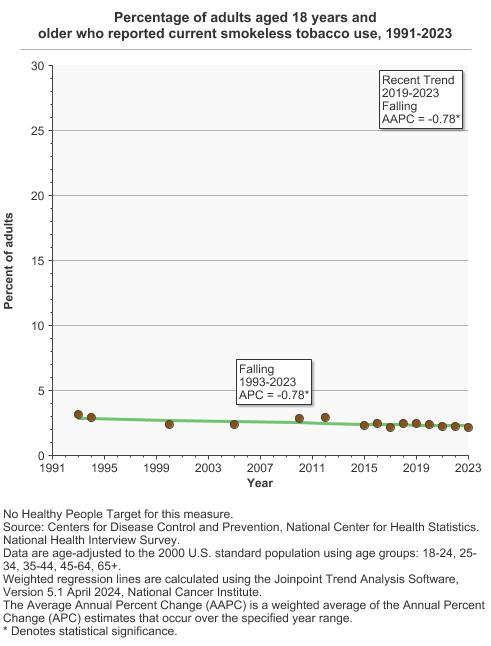
Smokeless Tobacco: Percentage of adults aged 18 years and older who used smokeless tobacco at least once in their lifetime and, at the time of the interview, used smokeless tobacco every day or some days.
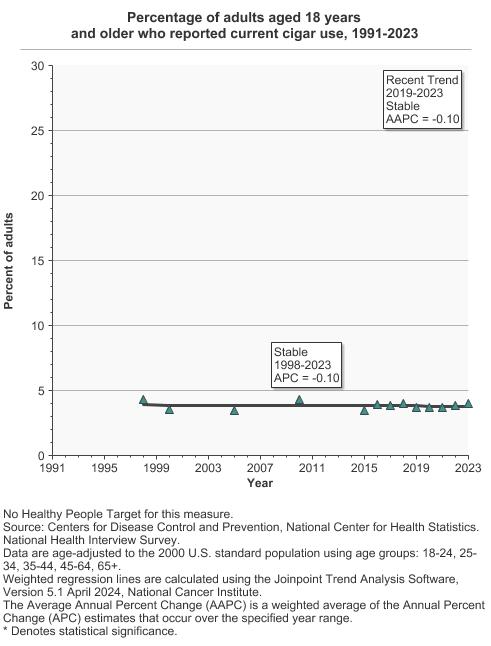
Cigars: Percentage of adults aged 18 years and older who smoked cigars at least once in their lifetime and, at the time of the interview, smoked cigars every day or some days.
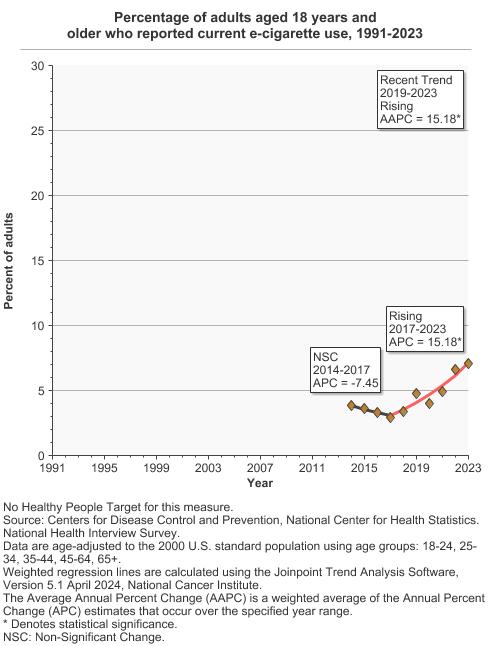
E-cigarettes: Percentage of adults aged 18 years and older who used e-cigarettes at least once in their lifetime and, at the time of the interview, used e-cigarettes every day or some days.
Data Source
Centers for Disease Control and Prevention, National Center for Health Statistics, National Health Interview Survey, 1965–2023.
Refer to the Data Sources page for more information about data collection years 2019+.
Healthy People 2030 Target
- Reduce to 6.1 percent the proportion of adults who currently smoke cigarettes.
Healthy People 2030 is a set of goals set forth by the Department of Health and Human Services.
Note: Goals are indicated as blue line on Detailed Trend Graphs.
Trends and Most Recent Estimates
- By Type of Tobacco Product
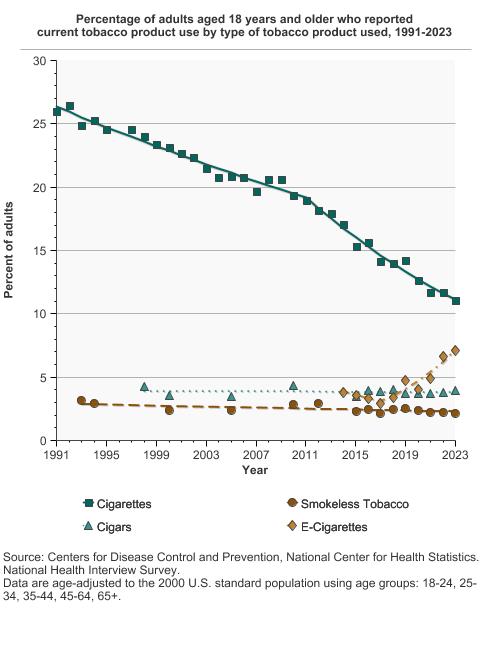
Percentage of adults aged 18 years and older who reported current tobacco product use by type of tobacco product used, 1991-2023 Overview Graph Detailed Trend Graphs Most Recent Estimates (2023) Percent of adults 95% Confidence Interval 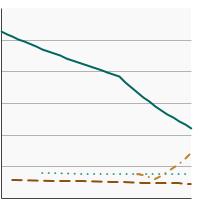

Cigarettes 
11.0 10.5 - 11.6 Smokeless Tobacco 2.2 2.0 - 2.4 Cigars 4.0 3.7 - 4.3 E-Cigarettes 7.1 6.7 - 7.6 - Cigarettes, Long Term Trends (1965+)
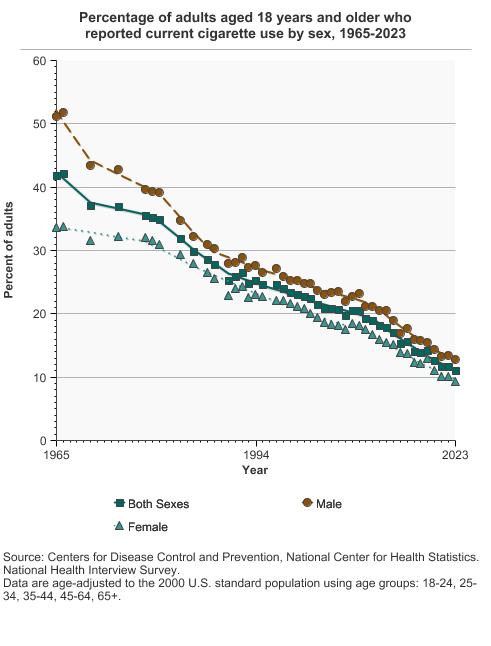
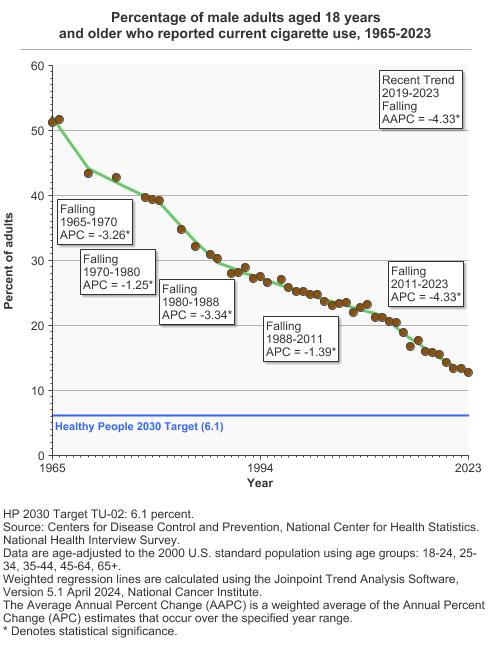
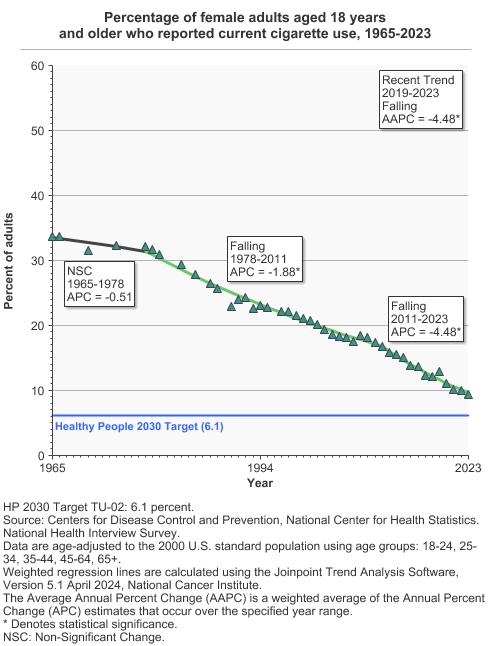
Percentage of adults aged 18 years and older who reported current cigarette use by sex, 1965-2023 Overview Graph Detailed Trend Graphs Most Recent Estimates (2023) Percent of adults 95% Confidence Interval 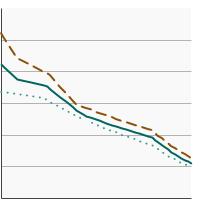
Both Sexes 11.0 10.5 - 11.6 Male 12.8 12.1 - 13.5 Female 9.3 8.7 - 10.0 - Cigarettes
- By Race/Ethnicity
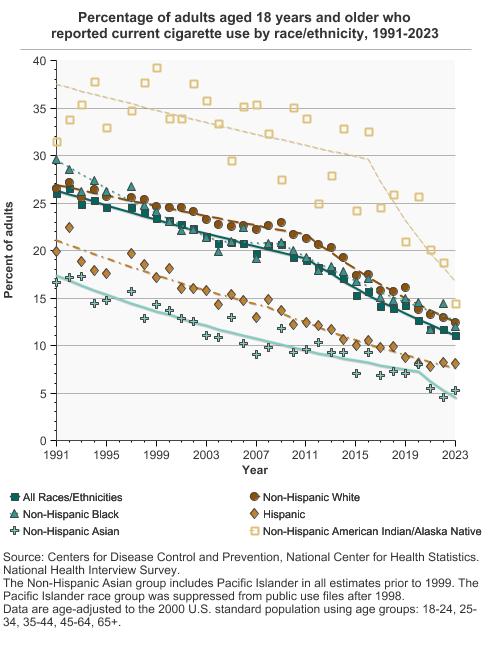
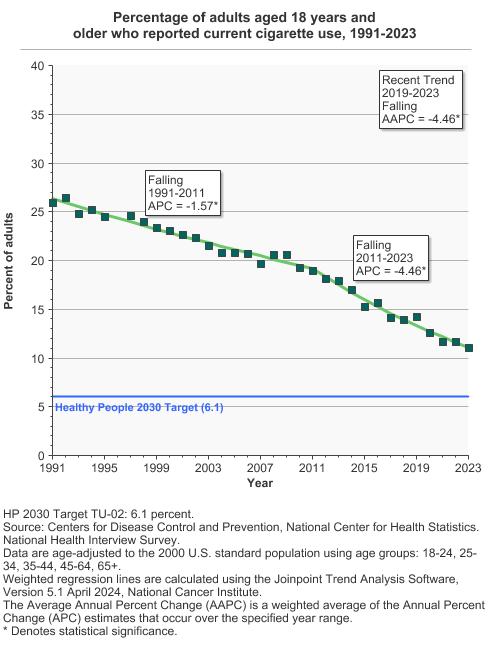
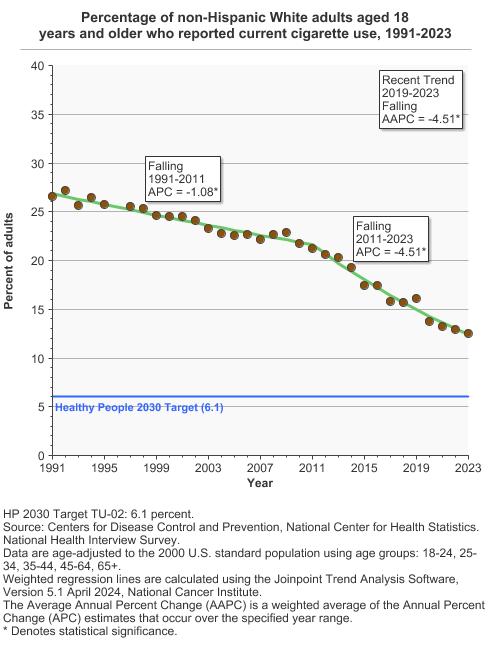
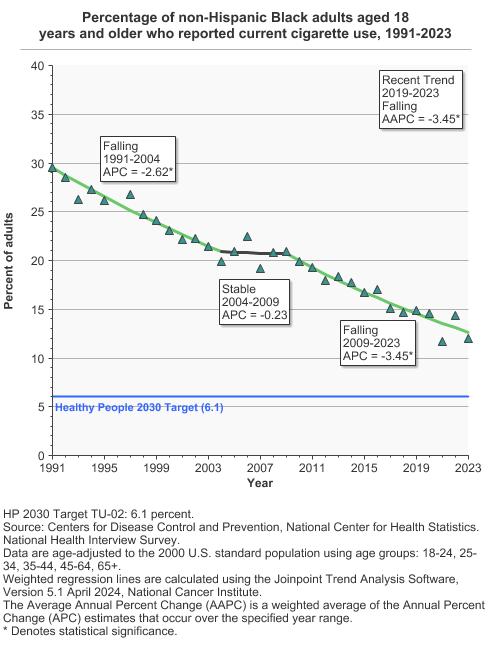
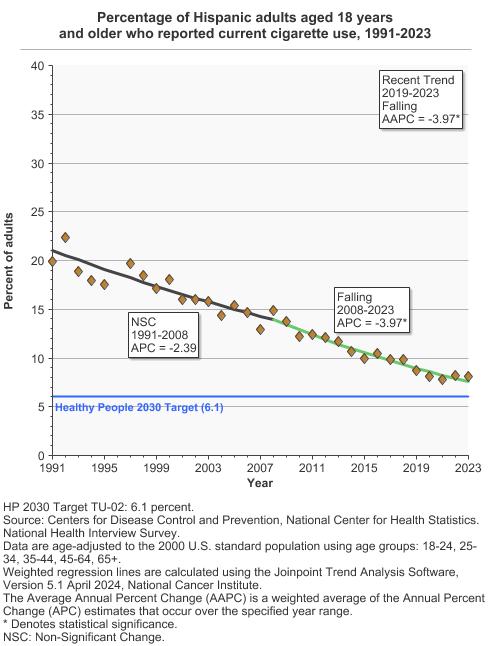
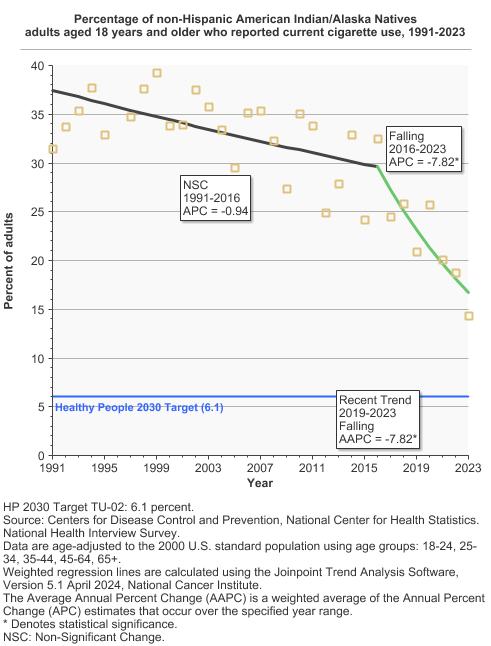
Percentage of adults aged 18 years and older who reported current cigarette use by race/ethnicity, 1991-2023 Overview Graph Detailed Trend Graphs Most Recent Estimates (2023) Percent of adults 95% Confidence Interval 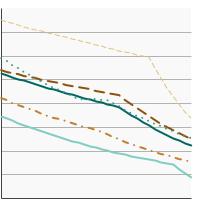
All Races/Ethnicities 11.0 10.5 - 11.6 Non-Hispanic White 12.5 11.8 - 13.2 Non-Hispanic Black 12.0 10.6 - 13.5 Hispanic 8.1 7.2 - 9.1 Non-Hispanic Asian 5.2 4.1 - 6.7 Non-Hispanic American Indian/Alaska Native 14.4 8.3 - 23.7 - By Age
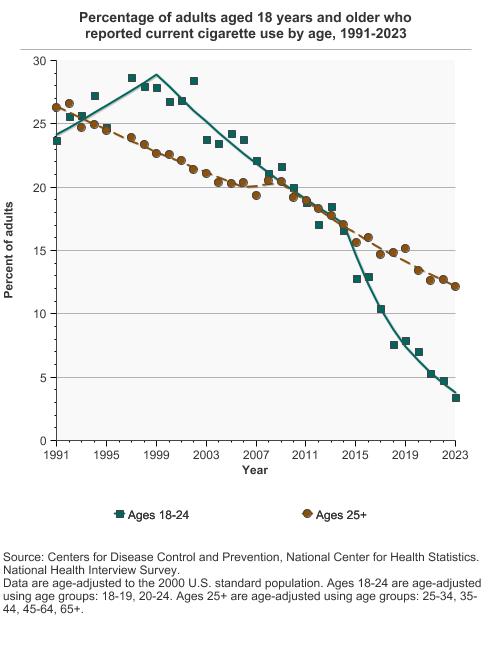
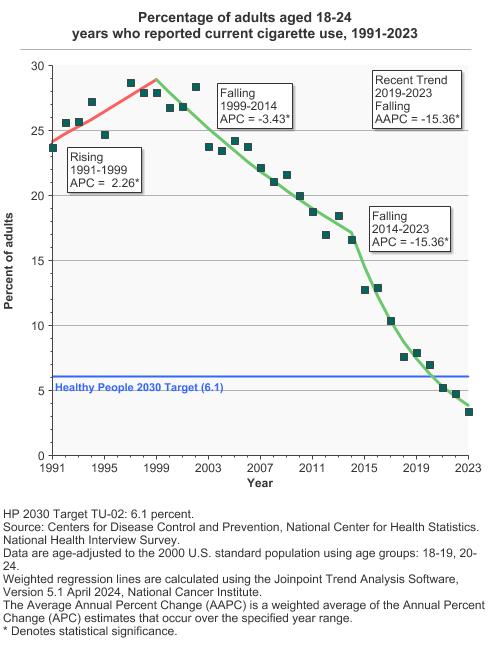
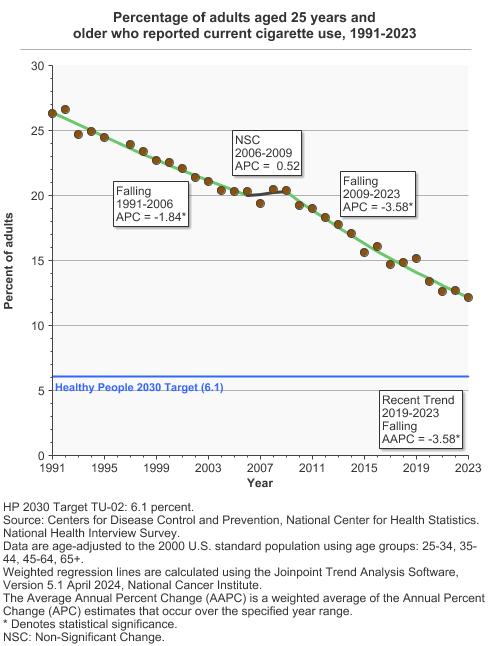
Percentage of adults aged 18 years and older who reported current cigarette use by age, 1991-2023 Overview Graph Detailed Trend Graphs Most Recent Estimates (2023) Percent of adults 95% Confidence Interval 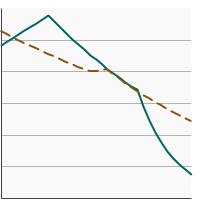
Ages 18-24 3.4 2.6 - 4.4 Ages 25+ 12.1 11.6 - 12.7 - By Poverty Income Level
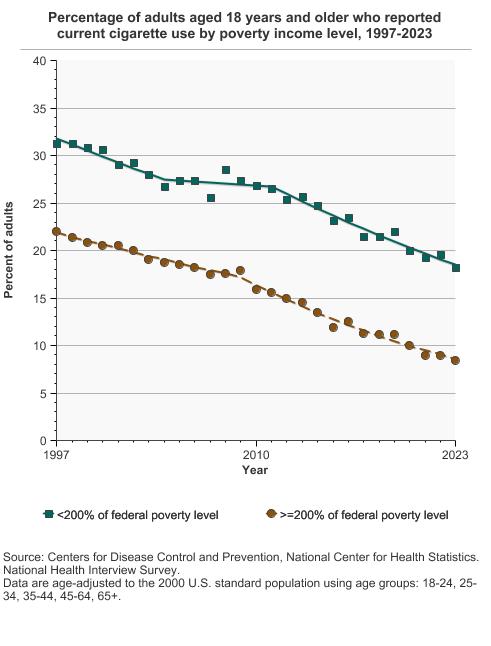
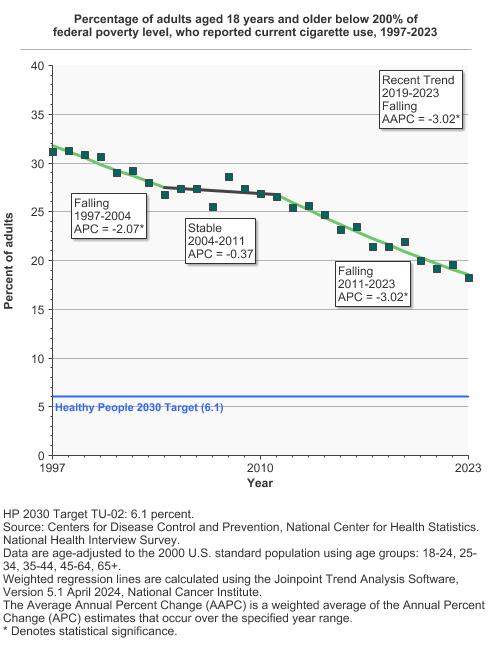
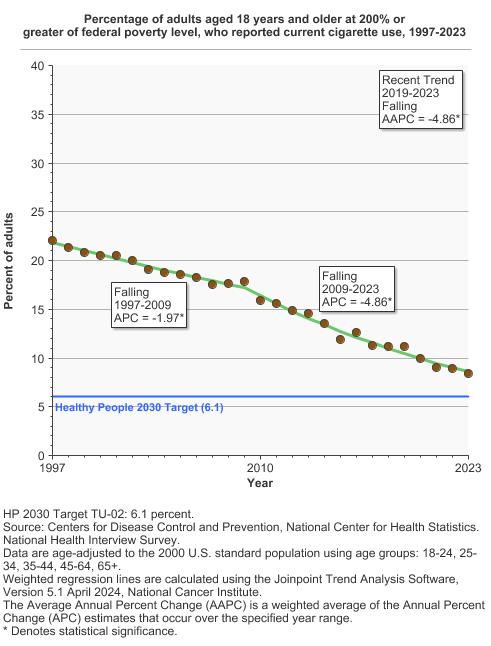
Percentage of adults aged 18 years and older who reported current cigarette use by poverty income level, 1997-2023 Overview Graph Detailed Trend Graphs Most Recent Estimates (2023) Percent of adults 95% Confidence Interval 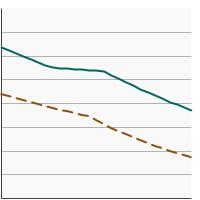
<200% of federal poverty level 18.2 17.1 - 19.4 >=200% of federal poverty level 8.5 8.0 - 9.0 - By Education Level
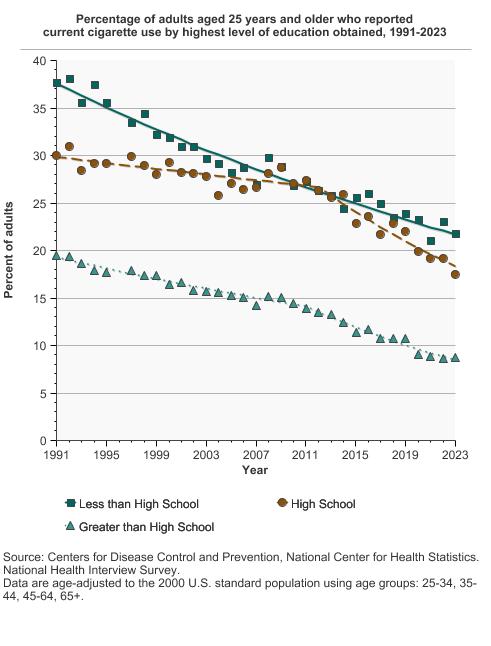
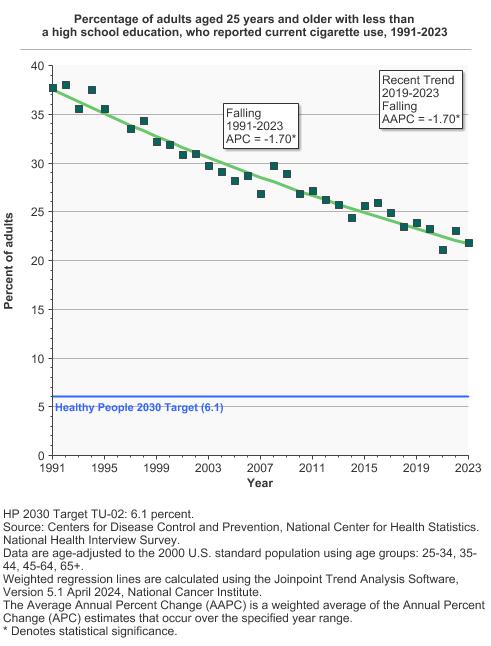
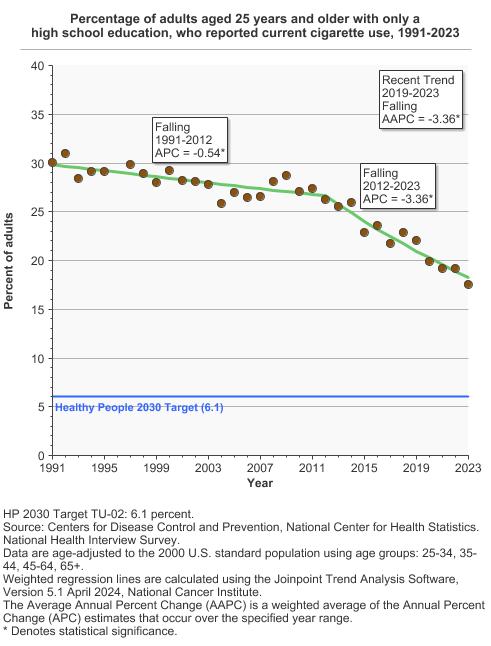
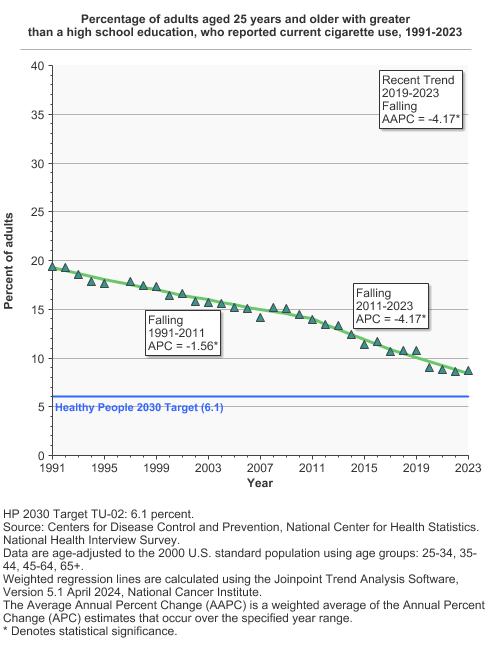
Percentage of adults aged 25 years and older who reported current cigarette use by highest level of education obtained, 1991-2023 Overview Graph Detailed Trend Graphs Most Recent Estimates (2023) Percent of adults 95% Confidence Interval 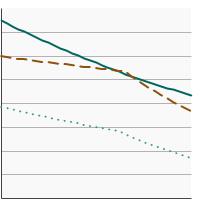
Less than High School 21.8 19.5 - 24.3 High School 17.5 16.2 - 18.9 Greater than High School 8.8 8.2 - 9.3 - By Smoking Frequency
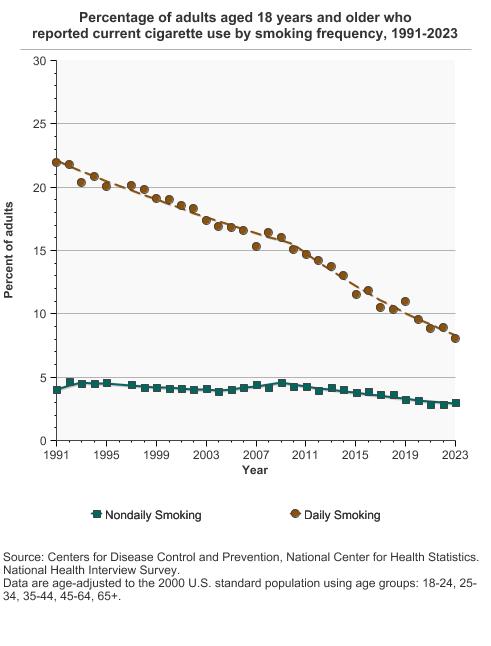
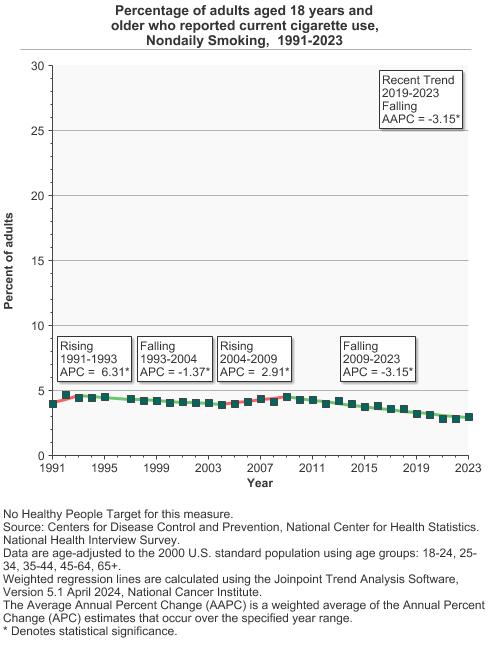
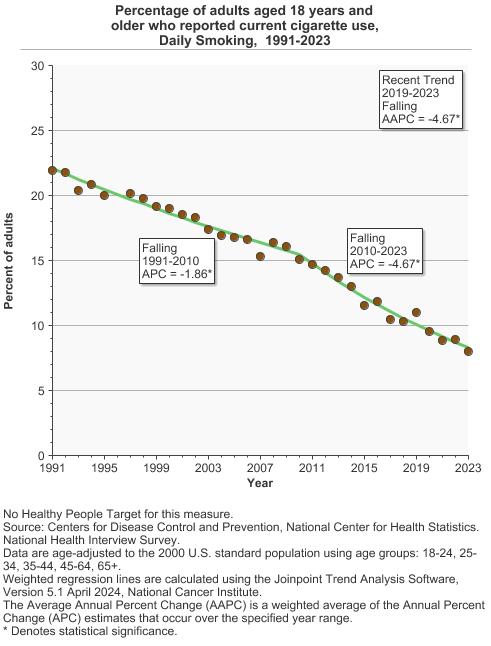
Percentage of adults aged 18 years and older who reported current cigarette use by smoking frequency, 1991-2023 Overview Graph Detailed Trend Graphs Most Recent Estimates (2023) Percent of adults 95% Confidence Interval 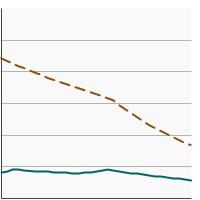
Nondaily Smoking 3.0 2.8 - 3.3 Daily Smoking 8.0 7.6 - 8.5
- Smokeless Tobacco
- By Sex
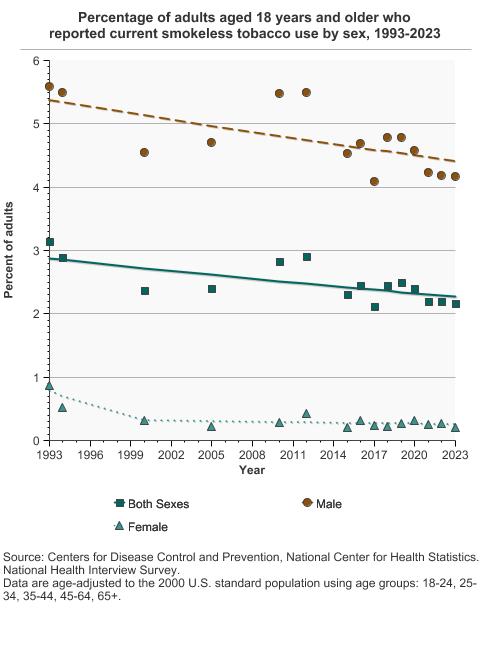
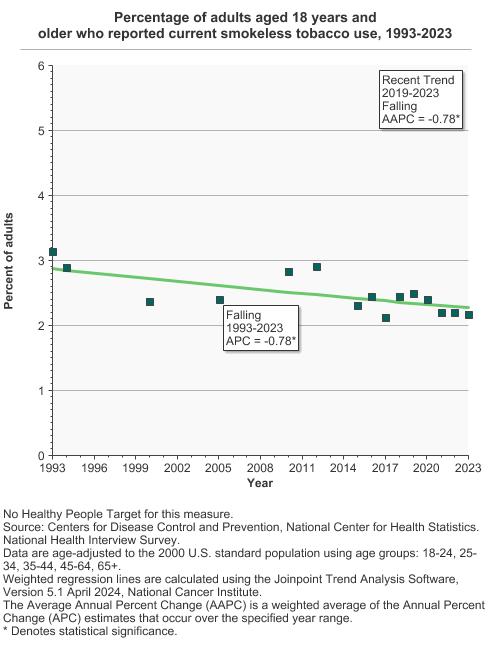
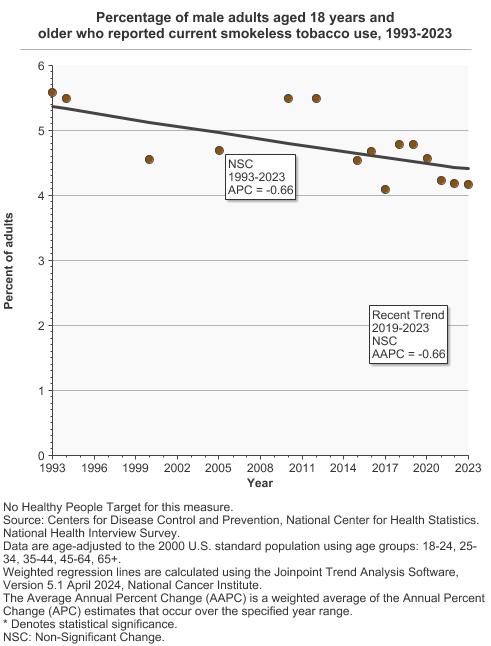
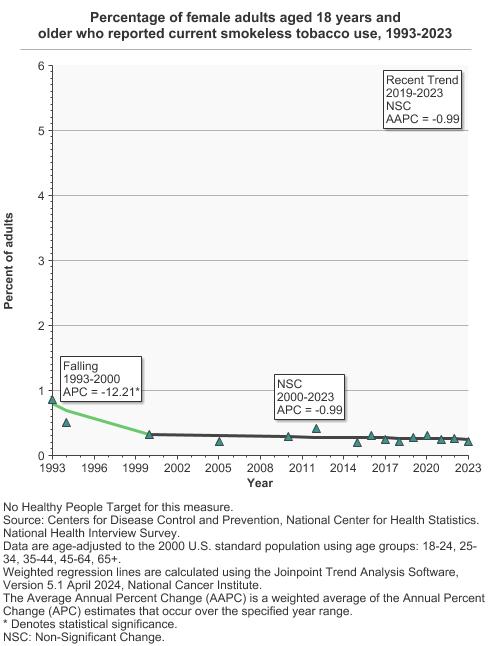
Percentage of adults aged 18 years and older who reported current smokeless tobacco use by sex, 1993-2023 Overview Graph Detailed Trend Graphs Most Recent Estimates (2023) Percent of adults 95% Confidence Interval 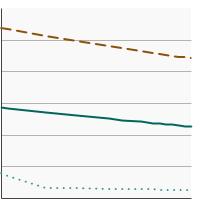
Both Sexes 2.2 2.0 - 2.4 Male 4.2 3.7 - 4.6 Female 0.2 0.1 - 0.3 - By Race/Ethnicity
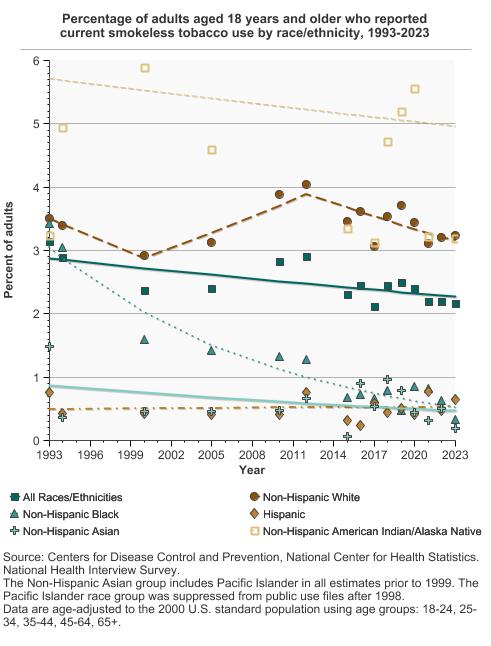
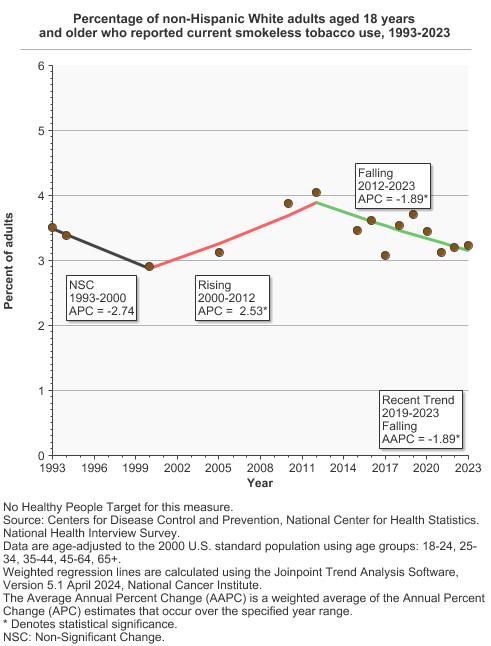
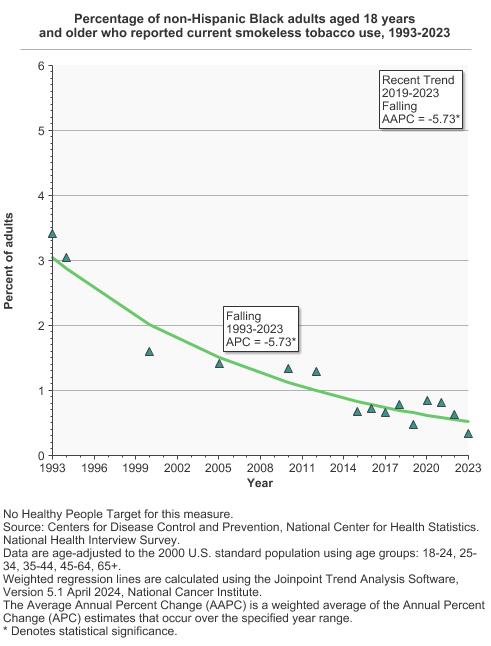
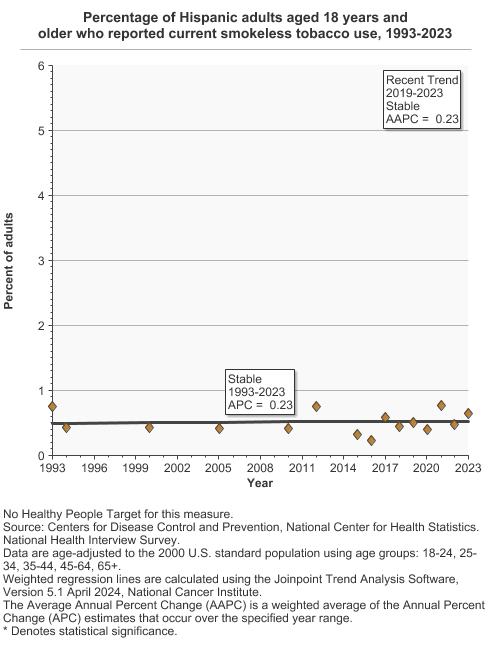
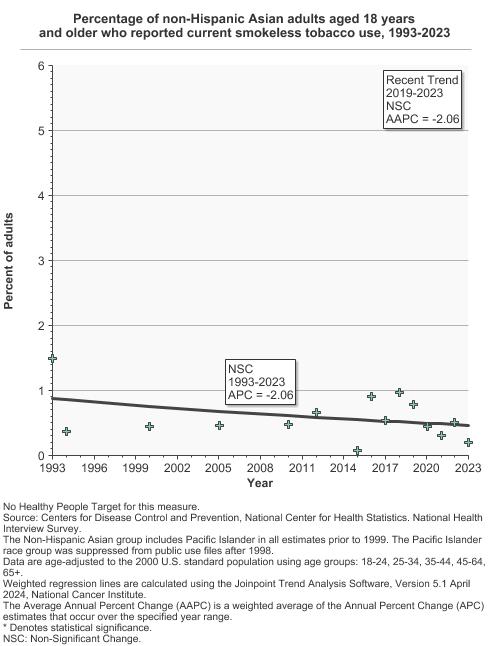
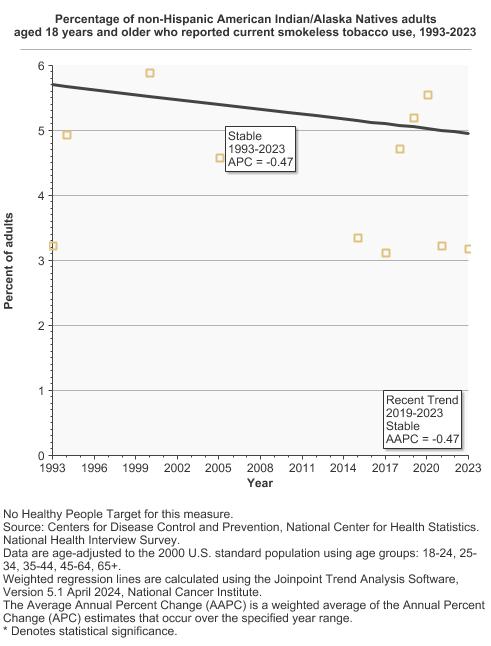
Percentage of adults aged 18 years and older who reported current smokeless tobacco use by race/ethnicity, 1993-2023 Overview Graph Detailed Trend Graphs Most Recent Estimates (2023) Percent of adults 95% Confidence Interval 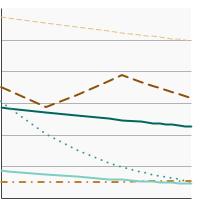
All Races/Ethnicities 2.2 2.0 - 2.4 Non-Hispanic White 3.2 2.9 - 3.6 Non-Hispanic Black 0.3 0.2 - 0.6 Hispanic 0.6 0.4 - 1.0 Non-Hispanic Asian 0.2 0.1 - 0.6 Non-Hispanic American Indian/Alaska Native 3.2 1.8 - 5.6 - By Age
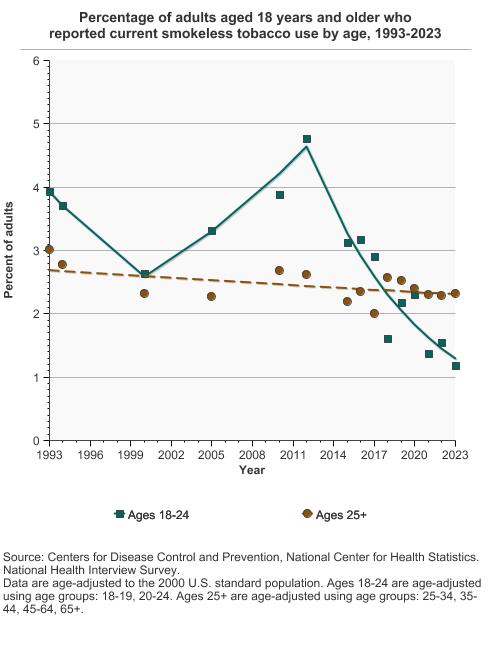
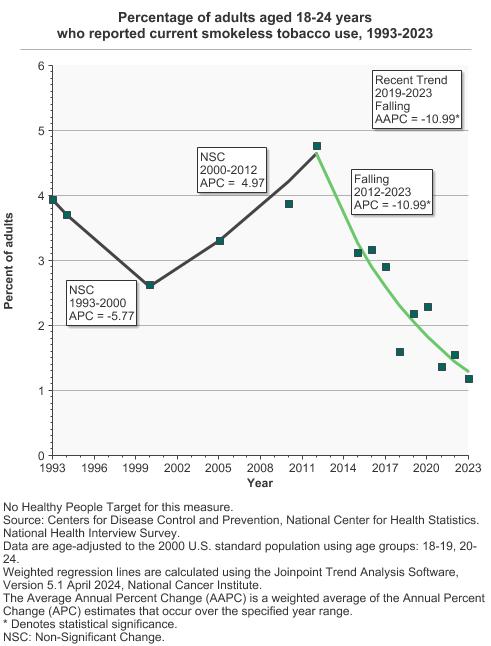
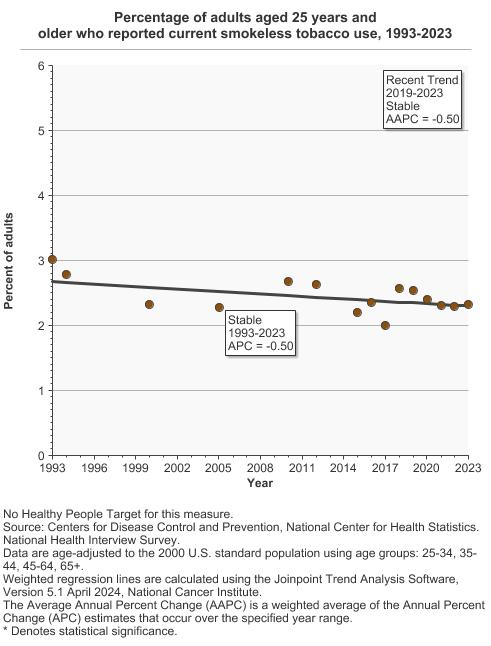
Percentage of adults aged 18 years and older who reported current smokeless tobacco use by age, 1993-2023 Overview Graph Detailed Trend Graphs Most Recent Estimates (2023) Percent of adults 95% Confidence Interval 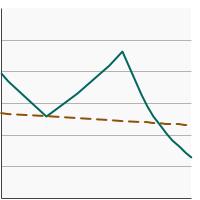
Ages 18-24 1.2 0.8 - 1.9 Ages 25+ 2.3 2.1 - 2.6 - By Poverty Income Level
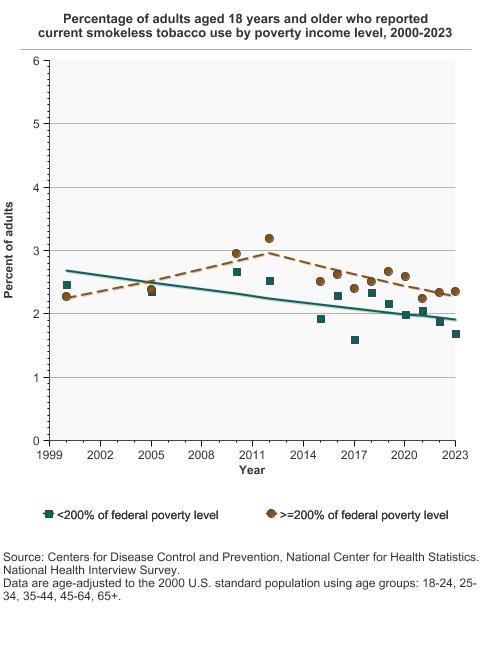
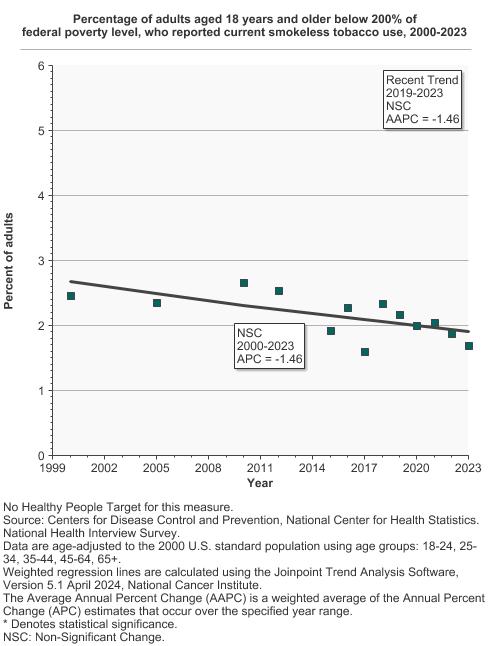
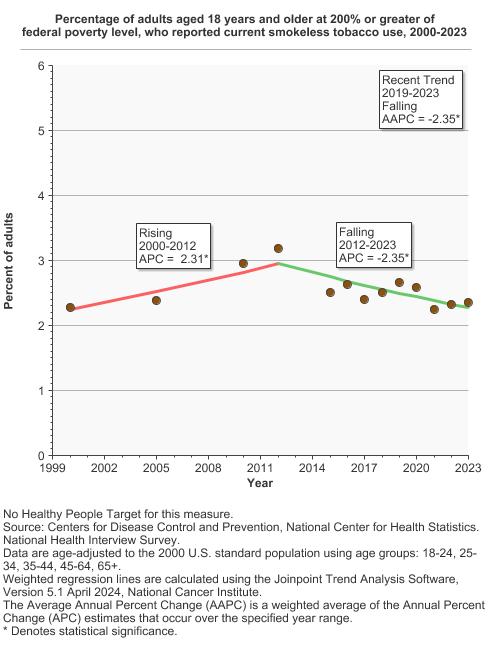
Percentage of adults aged 18 years and older who reported current smokeless tobacco use by poverty income level, 2000-2023 Overview Graph Detailed Trend Graphs Most Recent Estimates (2023) Percent of adults 95% Confidence Interval 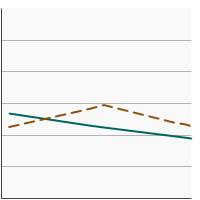
<200% of federal poverty level 1.7 1.4 - 2.1 >=200% of federal poverty level 2.4 2.1 - 2.6 - By Education Level
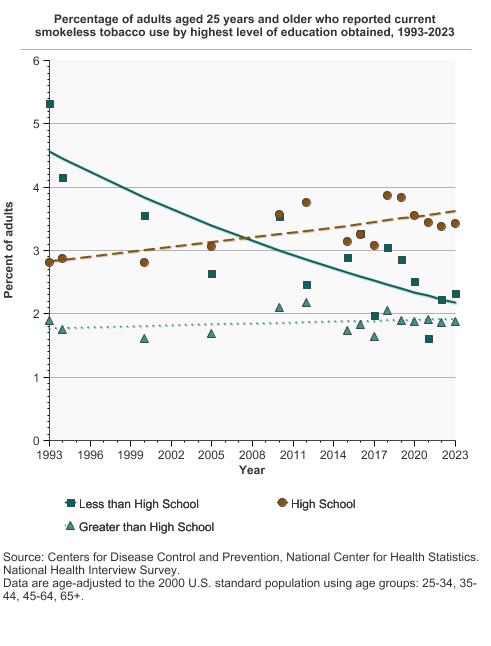
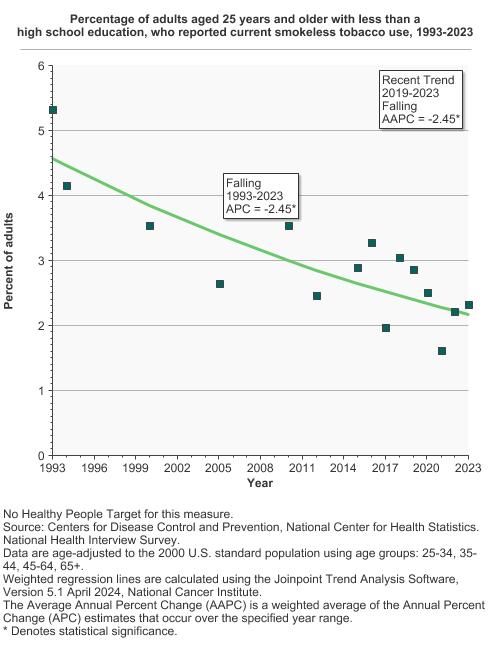
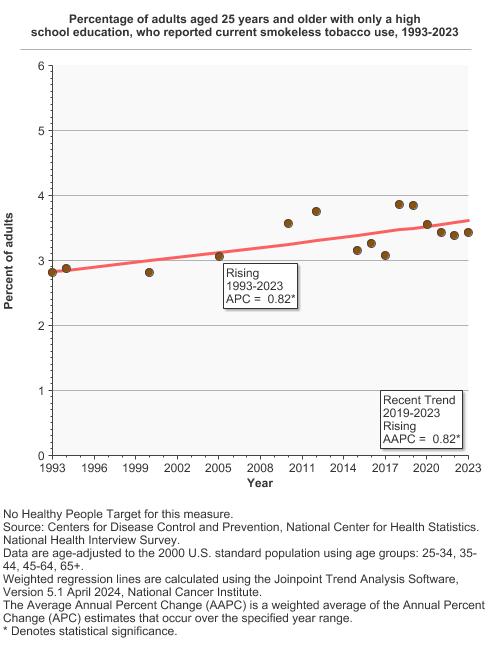
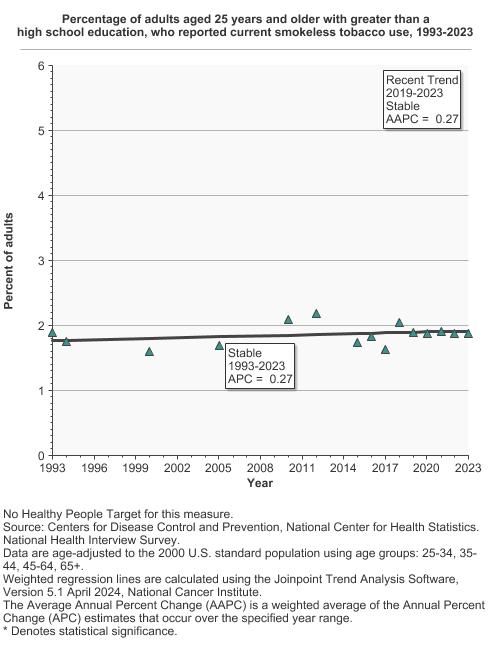
Percentage of adults aged 25 years and older who reported current smokeless tobacco use by highest level of education obtained, 1993-2023 Overview Graph Detailed Trend Graphs Most Recent Estimates (2023) Percent of adults 95% Confidence Interval 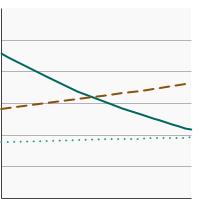
Less than High School 2.3 1.7 - 3.2 High School 3.4 2.9 - 4.1 Greater than High School 1.9 1.7 - 2.1
- Cigars
- By Sex
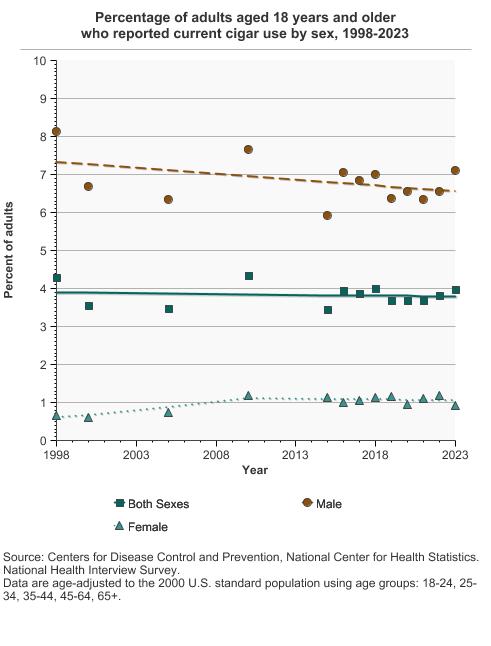
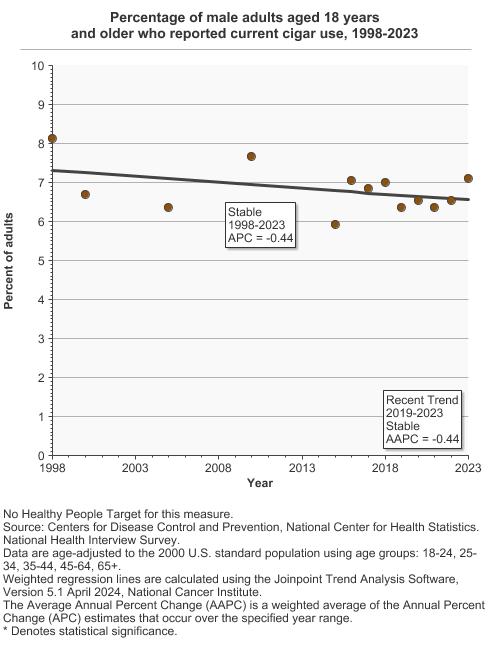
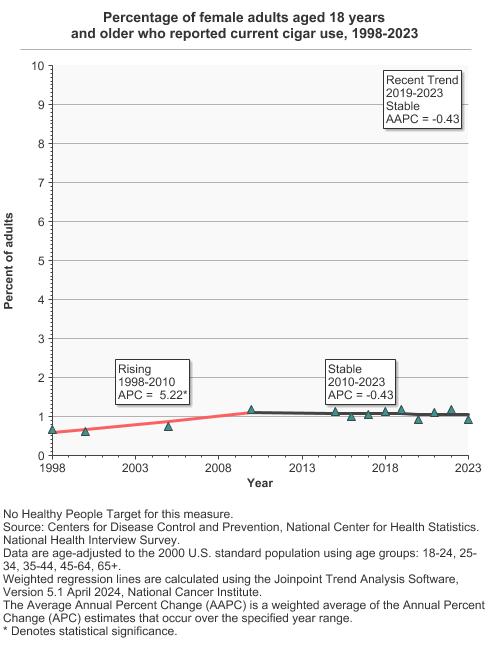
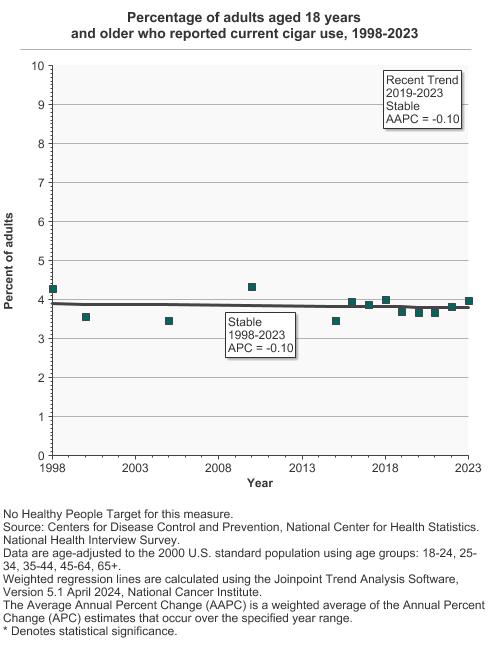
Percentage of adults aged 18 years and older who reported current cigar use by sex, 1998-2023 Overview Graph Detailed Trend Graphs Most Recent Estimates (2023) Percent of adults 95% Confidence Interval 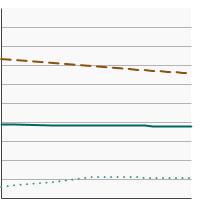
Both Sexes 4.0 3.7 - 4.3 Male 7.1 6.6 - 7.7 Female 0.9 0.7 - 1.1 - By Race/Ethnicity
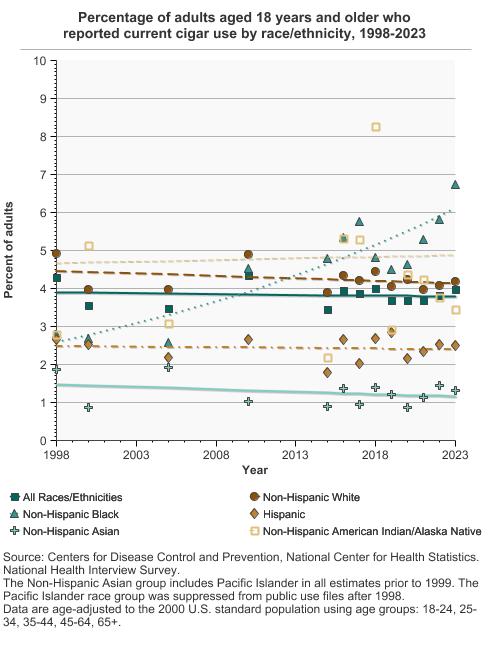
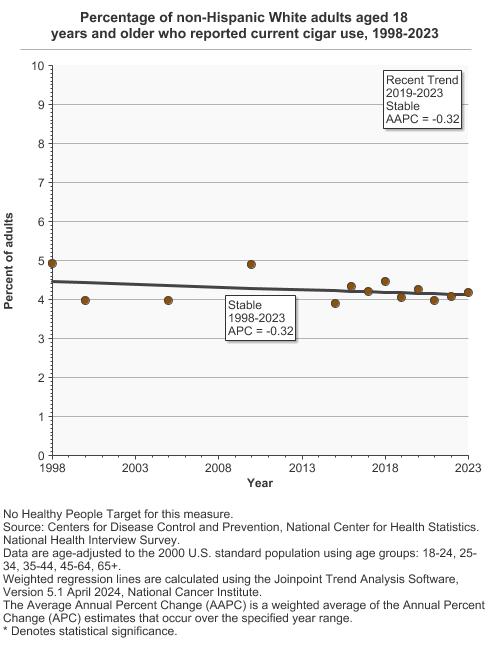
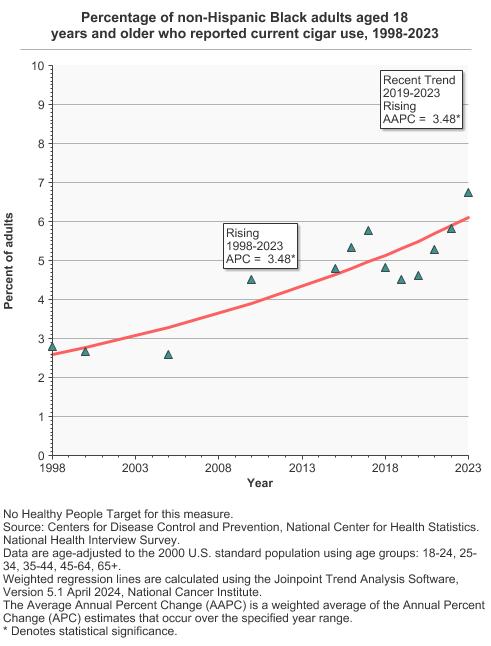
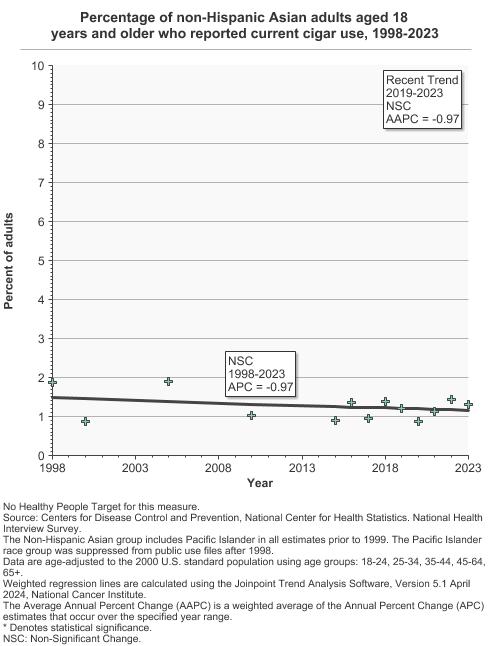
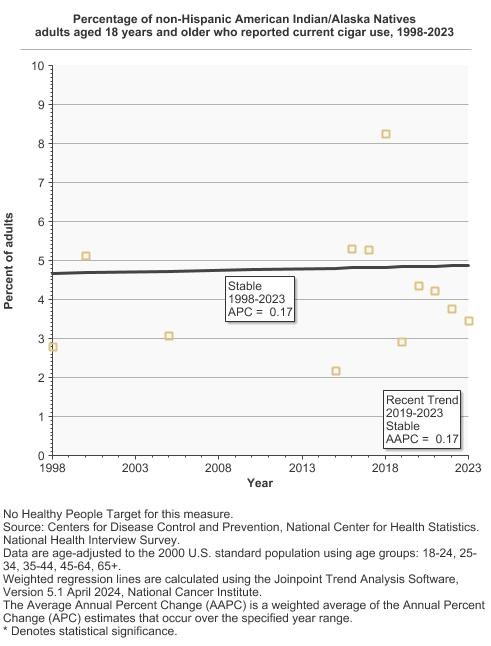
Percentage of adults aged 18 years and older who reported current cigar use by race/ethnicity, 1998-2023 Overview Graph Detailed Trend Graphs Most Recent Estimates (2023) Percent of adults 95% Confidence Interval 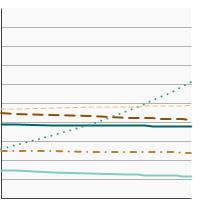
All Races/Ethnicities 4.0 3.7 - 4.3 Non-Hispanic White 4.2 3.8 - 4.6 Non-Hispanic Black 6.7 5.7 - 8.0 Hispanic 2.5 2.0 - 3.1 Non-Hispanic Asian 1.3 0.8 - 2.1 Non-Hispanic American Indian/Alaska Native 3.5 1.6 - 7.5 - By Age
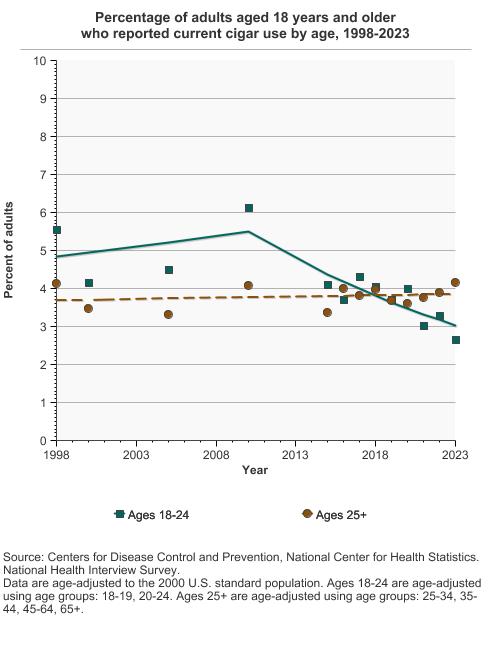
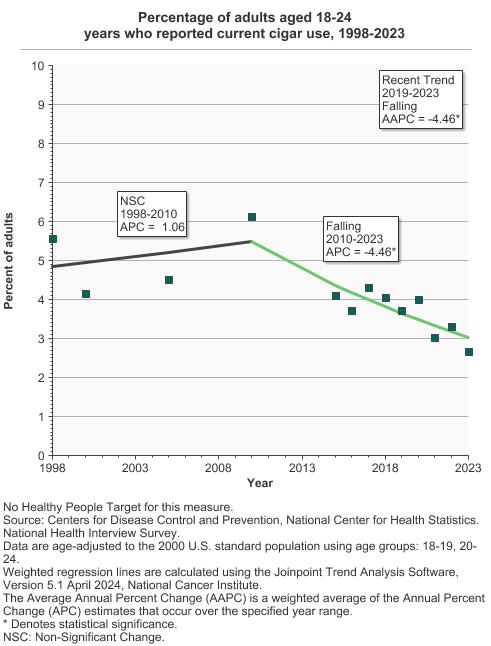
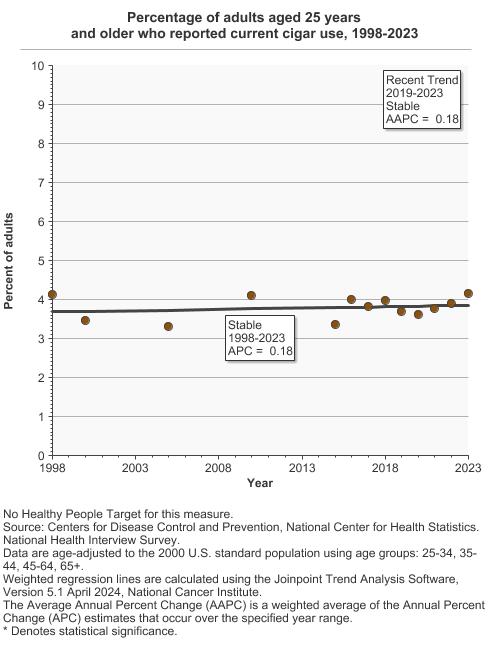
Percentage of adults aged 18 years and older who reported current cigar use by age, 1998-2023 Overview Graph Detailed Trend Graphs Most Recent Estimates (2023) Percent of adults 95% Confidence Interval 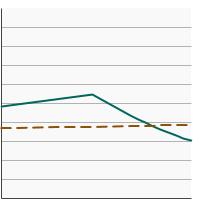
Ages 18-24 2.7 1.9 - 3.7 Ages 25+ 4.2 3.9 - 4.5 - By Poverty Income Level
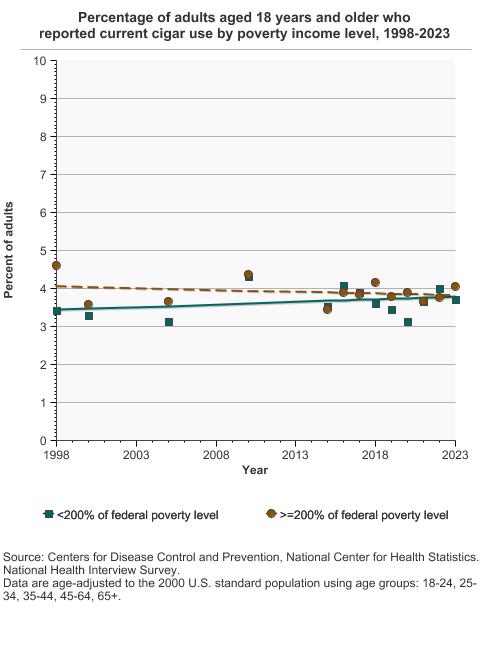
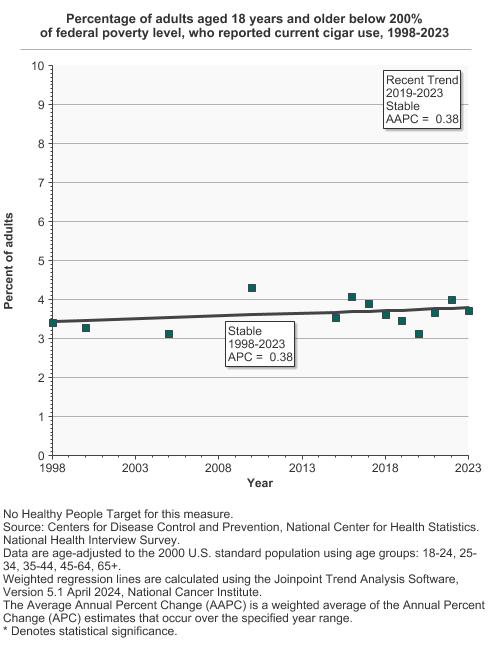
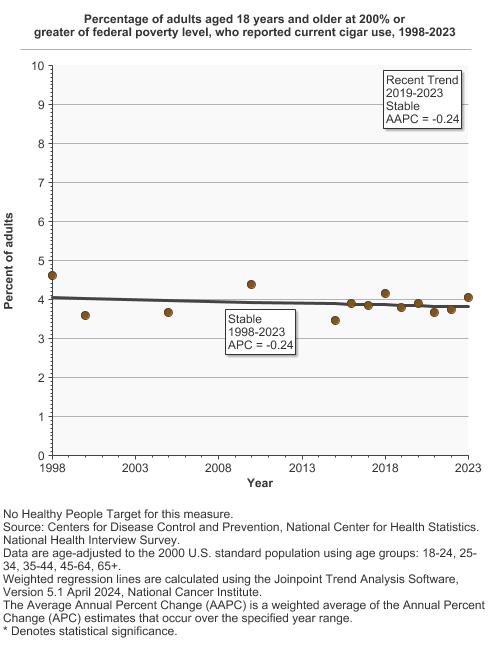
Percentage of adults aged 18 years and older who reported current cigar use by poverty income level, 1998-2023 Overview Graph Detailed Trend Graphs Most Recent Estimates (2023) Percent of adults 95% Confidence Interval 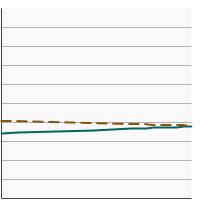
<200% of federal poverty level 3.7 3.2 - 4.4 >=200% of federal poverty level 4.1 3.7 - 4.4 - By Education Level
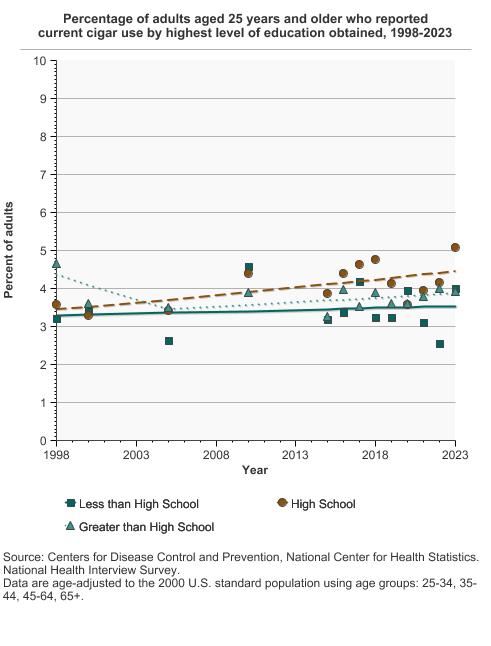
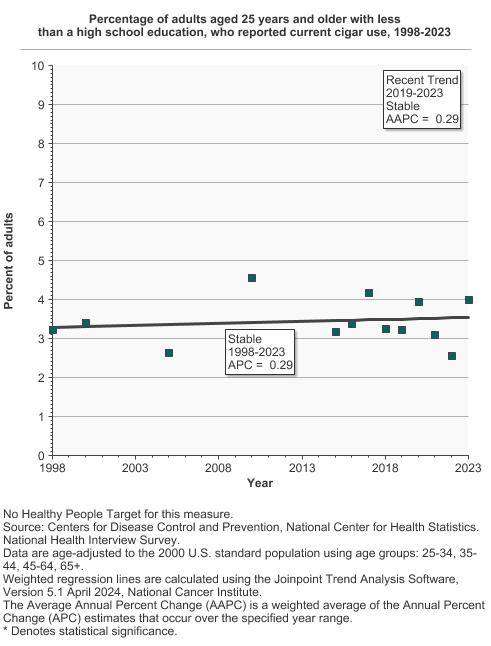
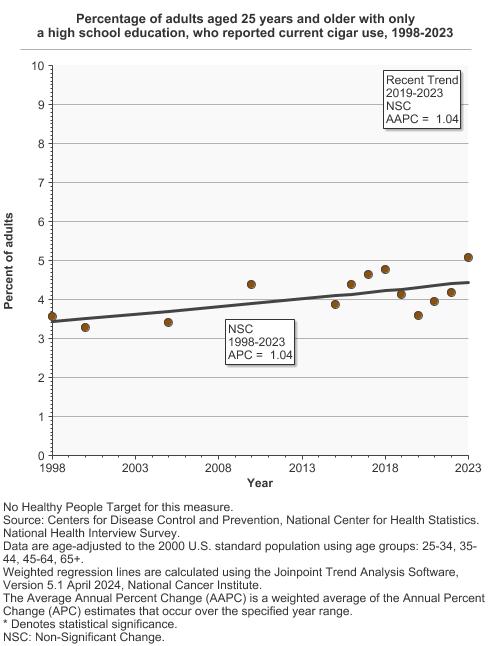
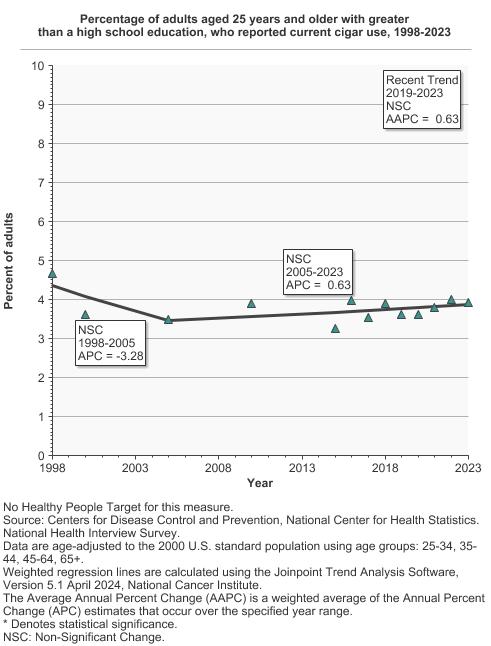
Percentage of adults aged 25 years and older who reported current cigar use by highest level of education obtained, 1998-2023 Overview Graph Detailed Trend Graphs Most Recent Estimates (2023) Percent of adults 95% Confidence Interval 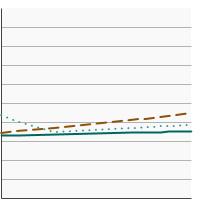
Less than High School 4.0 2.9 - 5.6 High School 5.1 4.4 - 5.9 Greater than High School 3.9 3.6 - 4.3
- E-Cigarettes
- By Sex
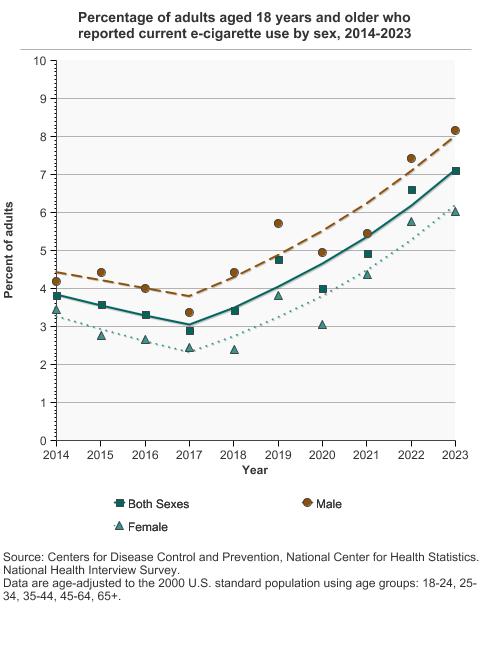
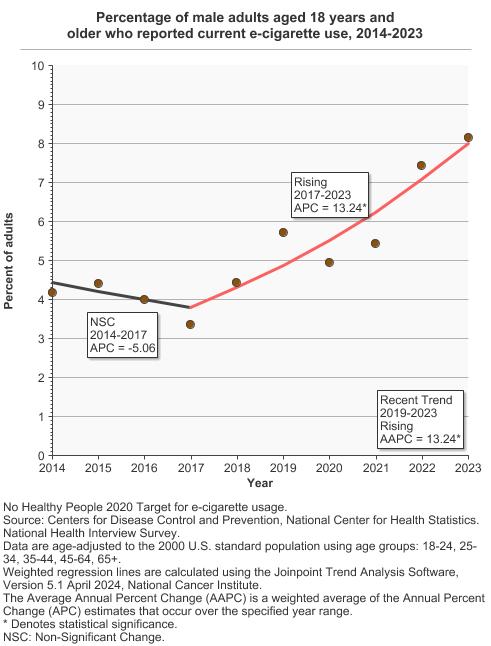
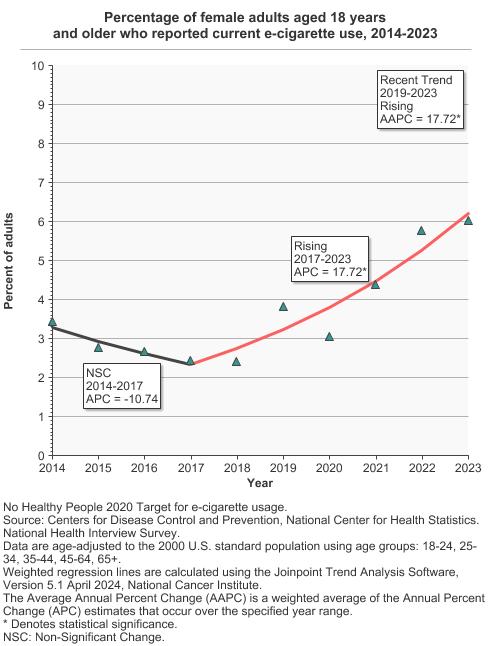
Percentage of adults aged 18 years and older who reported current e-cigarette use by sex, 2014-2023 Overview Graph Detailed Trend Graphs Most Recent Estimates (2023) Percent of adults 95% Confidence Interval 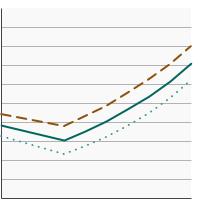
Both Sexes 7.1 6.7 - 7.6 Male 8.2 7.5 - 8.9 Female 6.0 5.5 - 6.6 - By Race/Ethnicity
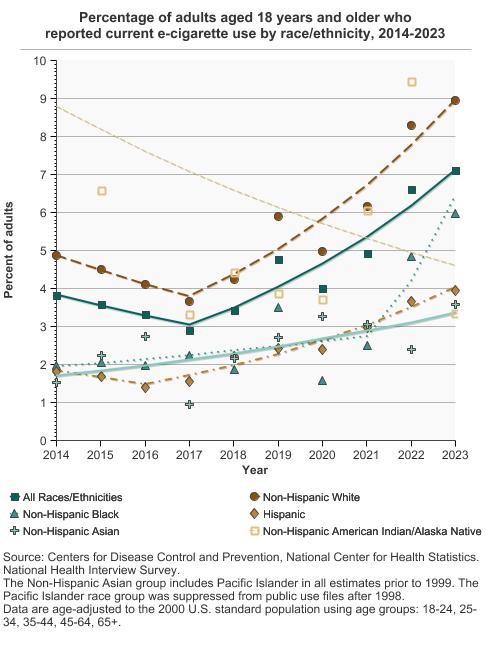
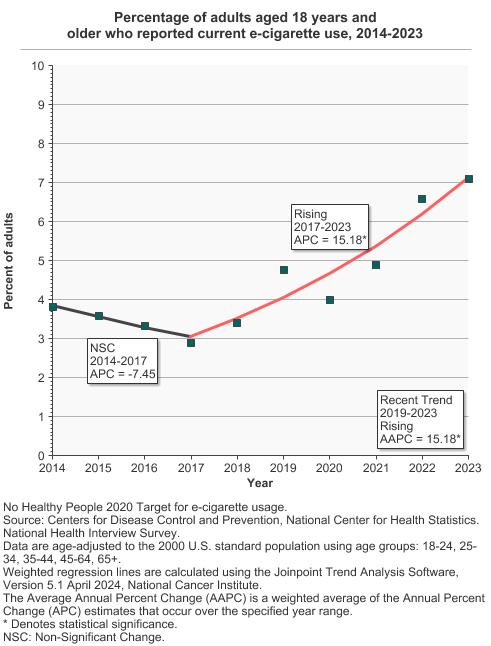
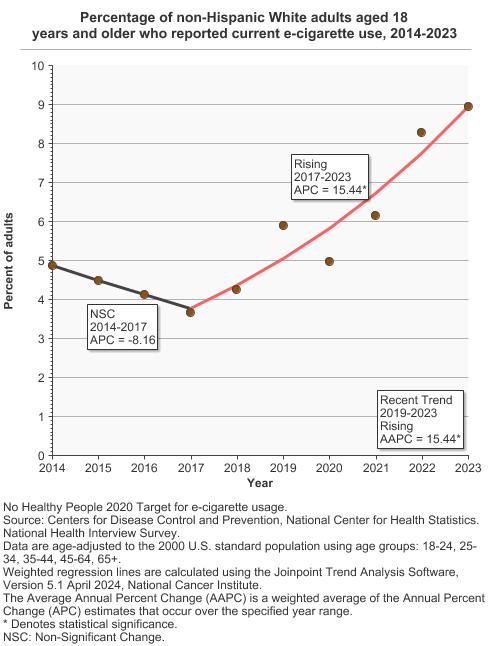
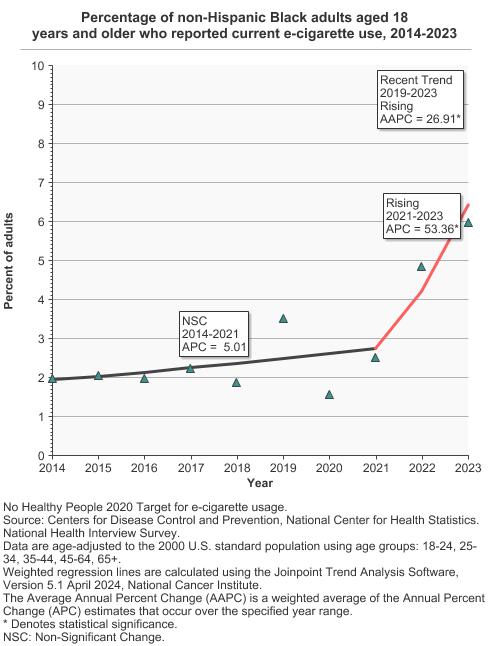
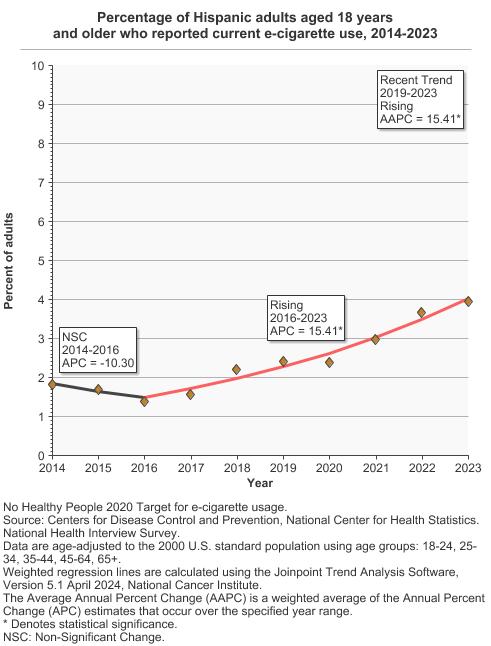
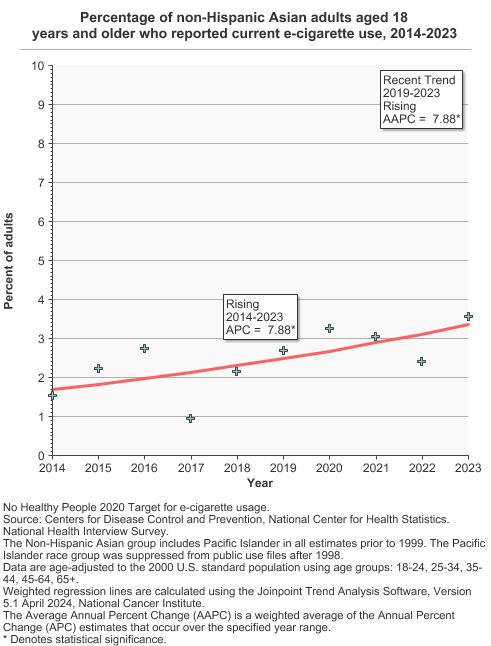
Percentage of adults aged 18 years and older who reported current e-cigarette use by race/ethnicity, 2014-2023 Overview Graph Detailed Trend Graphs Most Recent Estimates (2023) Percent of adults 95% Confidence Interval 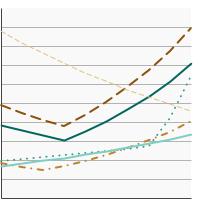
All Races/Ethnicities 7.1 6.7 - 7.6 Non-Hispanic White 8.9 8.3 - 9.6 Non-Hispanic Black 6.0 4.8 - 7.3 Hispanic 3.9 3.3 - 4.7 Non-Hispanic Asian 3.6 2.7 - 4.7 Non-Hispanic American Indian/Alaska Native 3.4 1.0 - 10.5 - By Age
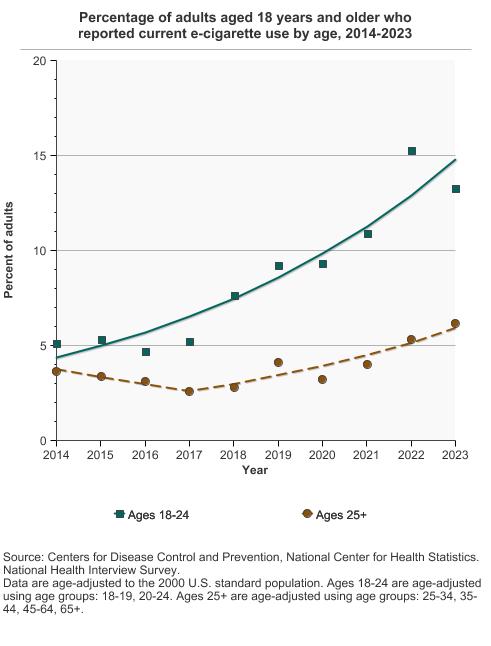
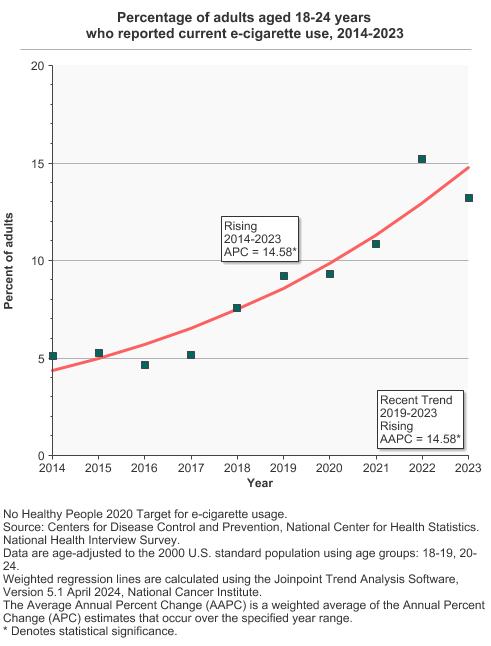
Percentage of adults aged 18 years and older who reported current e-cigarette use by age, 2014-2023 Overview Graph Detailed Trend Graphs Most Recent Estimates (2023) Percent of adults 95% Confidence Interval 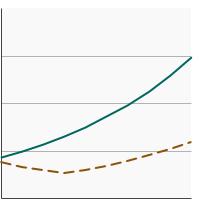
Ages 18-24 13.2 11.6 - 15.1 Ages 25+ 6.2 5.8 - 6.6 - By Sex and Age
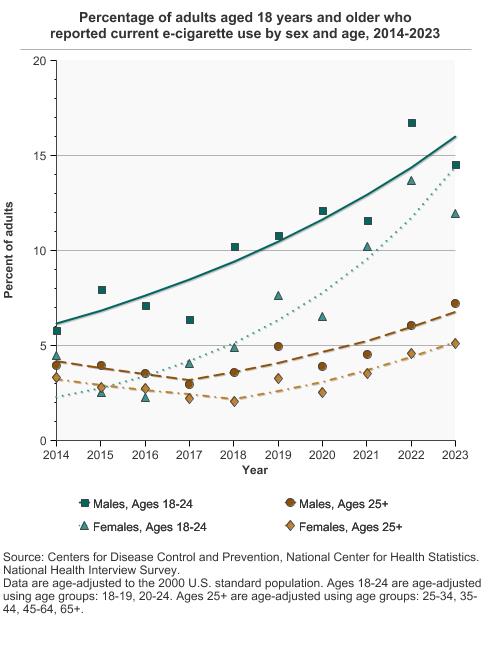
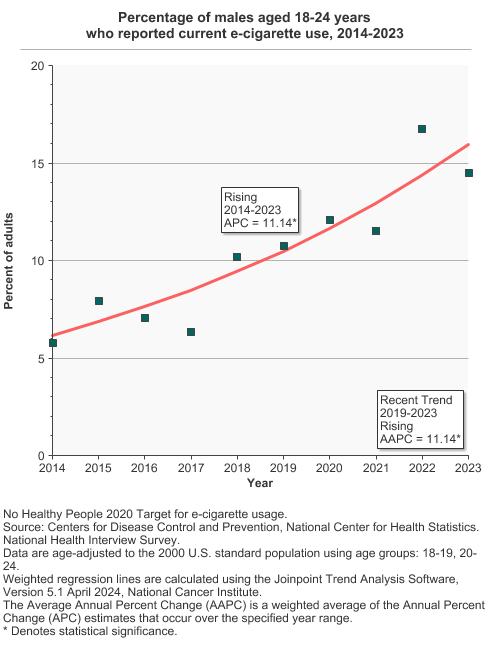
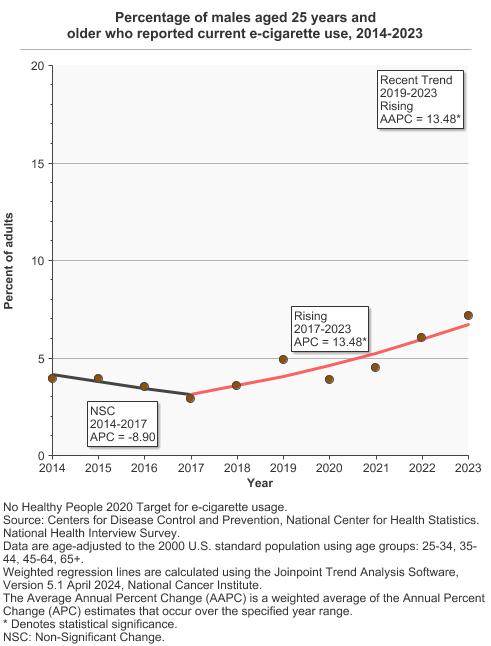
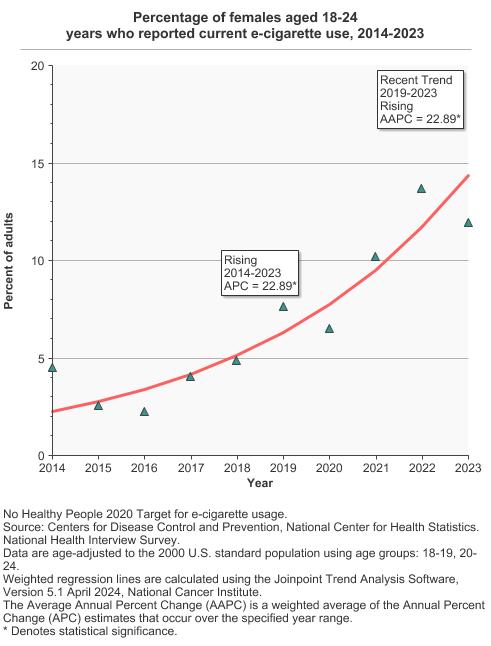
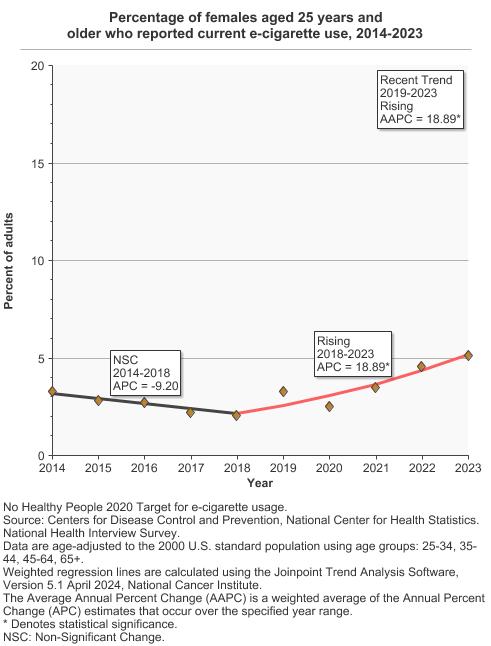
Percentage of adults aged 18 years and older who reported current e-cigarette use by sex and age, 2014-2023 Overview Graph Detailed Trend Graphs Most Recent Estimates (2023) Percent of adults 95% Confidence Interval 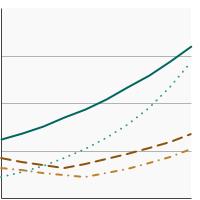
Males, Ages 18-24 14.5 12.3 - 17.0 Males, Ages 25+ 7.2 6.6 - 7.9 Females, Ages 18-24 12.0 9.7 - 14.7 Females, Ages 25+ 5.1 4.7 - 5.6


Additional Information
- Tobacco. National Cancer Institute.
- Stay Away from Tobacco. American Cancer Society.
- Smoking and Tobacco Use. Centers for Disease Control and Prevention.
- Tobacco Products. U.S. Food and Drug Administration.
Quitting Resources
- Cigarette Smoking: Health Risks and How to Quit (PDQ®)–Patient Version. National Cancer Institute.
- Smokefree.gov. National Cancer Institute.
- Where To Get Help When You Decide To Quit Smoking. National Cancer Institute.
- How to Quit Smoking or Smokeless Tobacco. American Cancer Society.
- How to Quit Smoking. Centers for Disease Control and Prevention.
- What You Need To Know About Quitting Smoking: Advice from the Surgeon General. Centers for Disease Control and Prevention.
- Cigarette Smoking: Health Risks and How to Quit (PDQ®)–Health Professional Version. National Cancer Institute.
- Tobacco Control Evidence-Based Programs Listing. National Cancer Institute.
- Treating Tobacco Use and Dependence: 2008 Update – Clinical Practice Guidelines. U.S. Public Health Service.
- Best Practices for Comprehensive Tobacco Control Programs—2014. Centers for Disease Control and Prevention.
- Best Practices: Putting Evidence into Practice. Centers for Disease Control and Prevention.
- Smoking and Tobacco Use – Patient Care. Centers for Disease Control and Prevention.
- Smoking Cessation – The Role of Healthcare Professionals and Health Systems. Centers for Disease Control and Prevention.
- Surgeon General’s Reports on Smoking and Tobacco Use. Centers for Disease Control and Prevention.
- Tips from Former Smokers. Centers for Disease Control and Prevention.
- Tobacco Use. Million Hearts.
- North American Quitline Consortium. North American Quitline Consortium.
- Cigar-Smoking Patterns by Race/Ethnicity and Cigar Type: A Nationally Representative Survey Among U.S. Adults. Chen-Sankey JC, Mead-Morse EL, Le D, et al. Am J Prev Med. 2021; 60(1):87-94.
- Tobacco Product Use Among Adults – United States, 2021. Cornelius ME, Loretan CG, Jamal A, et al. MMWR Morb Mortal Wkly Rep 2023;72:475–483.
- Patterns of Premium and Non-Premium Cigar Use in the United States: Findings from Wave 6 (2021) of the Population Assessment of Tobacco and Health Study. Edwards KC, Halenar MJ, Delnevo CD, et al. Nicotine Tob Res. 2023;25(Suppl_1):S5-S15.
- Dose-Response Association of Low-Intensity and Nondaily Smoking With Mortality in the United States. Inoue-Choi M, Christensen CH, Rostron BL, et al. JAMA Netw Open. 2020; 3(6):e206436.
- Demographic Characteristics, Cigarette Smoking, and e-Cigarette Use Among US Adults. Mayer M, Reyes-Guzman C, Grana R, et al. JAMA Netw Open. 2020; 3(10):e2020694.
- Not Quite the Rule, But No Longer the Exception: Multiple Tobacco Product Use and Implications for Treatment, Research, and Regulation. Pacek LR, Villanti AC, Mcclernon FJ. Nicotine Tob Res. 2020;22(11):2114-2117.
- September 2022 Tobacco Use Supplement to the Current Population Survey (TUS-CPS) Data Brief. National Cancer Institute.
- State Cancer Profiles. National Cancer Institute.
- Cancer Facts and Figures. American Cancer Society.
- Behavioral Risk Factor Surveillance System Prevalence and Trends Data. Centers for Disease Control and Prevention.
- Current Cigarette Smoking Among Adults in the United States. Centers for Disease Control and Prevention.
- Reports and Detailed Tables From the 2023 National Survey on Drug Use and Health. Substance Abuse and Mental Health Services Administration.