On This Page:
- Background
- Measure
- Healthy People 2030 Target
- Data Source
- Trends and Most Recent Estimates
- Additional Information
Background
Sleep health – including sleep duration, efficiency, and quality, as well as sleep timing and regularity – is important to overall health. Poor sleep may directly affect mortality risk and influence risk for cancer and other non-communicable diseases through its impact on immune function, stress response and inflammation, DNA repair, and metabolic and hormonal activity. It may also impact mortality through its effect on modifiable risk factors, including physical activity, diet, alcohol, and tobacco use.
Existing evidence indicates that sleep duration is associated with cancer mortality. However, across sites, risk may vary by sleep duration – both short (<7 hours/night) and long (>9 hours/night) sleep duration. Findings are also mixed regarding the association between sleep duration and cancer risk. Other aspects of poor sleep health, including poor sleep quality and irregular sleep timing due to shift work, have also been linked to increased risk of cancer, highlighting the need for future research in these areas.
Additionally, poor sleep health is associated with poorer treatment efficacy, adverse physical and mental health outcomes, and increased mortality in cancer survivors. The mechanisms connecting sleep health and cancer survivorship are not fully understood and are an evolving area of study.
The recommendations stratified by age are 7 or more hours/night for adults 18-60 years, 7-9 hours for adults 31-64 years, and 7–8 hours for adults 65 years and older.
Measure
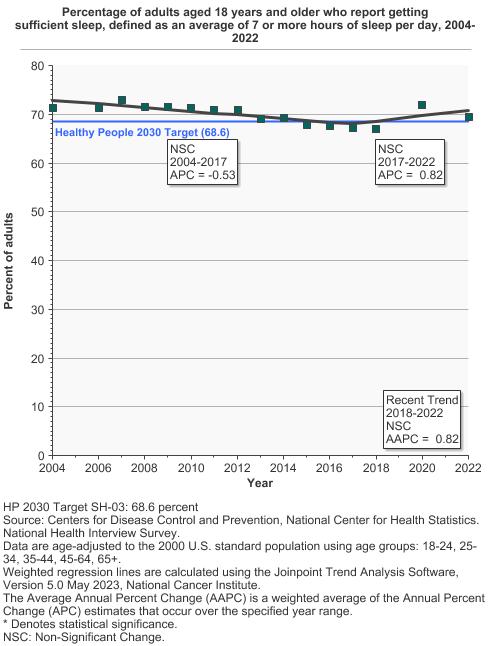
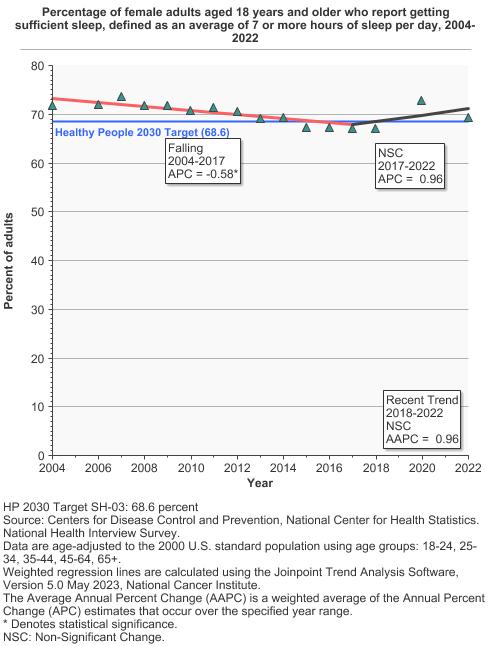
Percentage of adults aged 18 years and older who report getting sufficient sleep, defined as an average of 7 or more hours of sleep per day.
Data Source
Centers for Disease Control and Prevention, National Center for Health Statistics, National Health Interview Survey 2004-2022.
Refer to the Data Sources page for more information about data collection years 2019+.
Healthy People 2030 Target
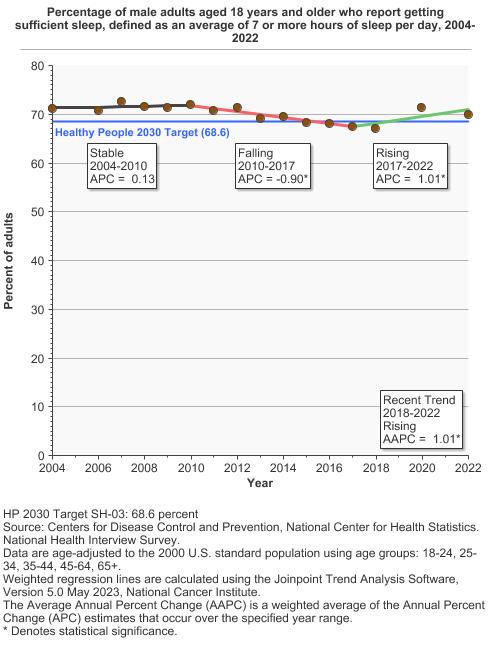
- Increase the proportion of adults who get sufficient sleep to 68.6 percent.
Healthy People 2030 is a set of goals set forth by the Department of Health and Human Services.
Note: Goals are indicated as a blue line on Detailed Trend Graphs.
Trends and Most Recent Estimates
- By Sex
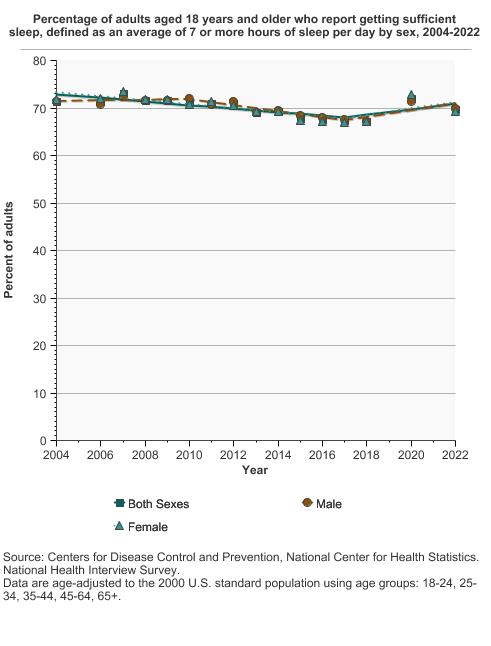
Percentage of adults aged 18 years and older who report getting sufficient sleep, defined as an average of 7 or more hours of sleep per day by sex, 2004-2022 Overview Graph Detailed Trend Graphs Most Recent Estimates (2022) Percent of adults 95% Confidence Interval 

Both Sexes 
69.6 68.8 - 70.3 Male 70.0 68.9 - 71.0 Female 69.2 68.3 - 70.2 - By Race/Ethnicity
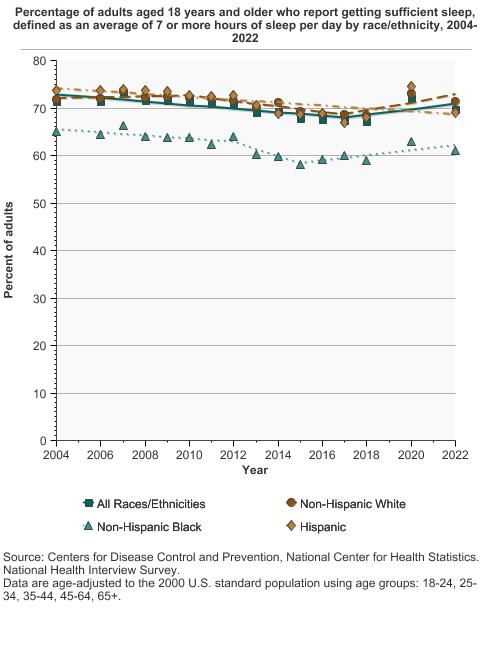
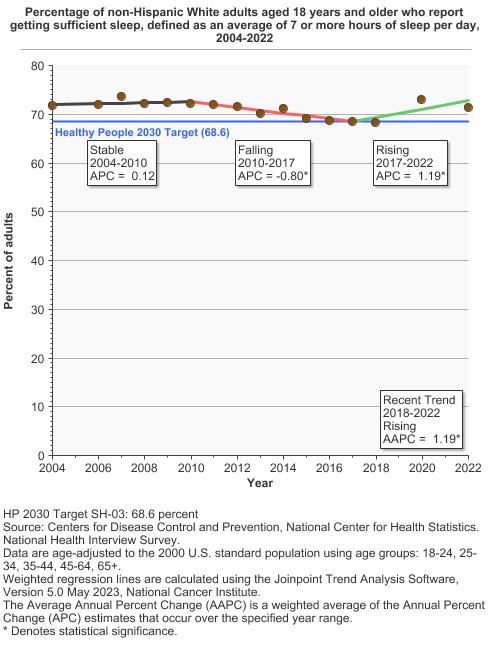
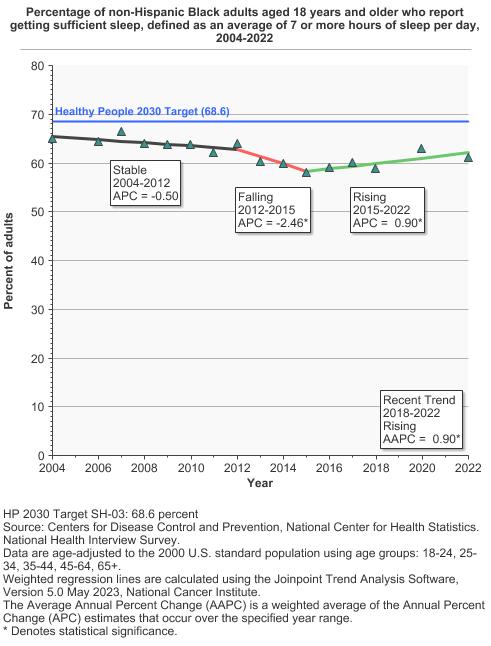
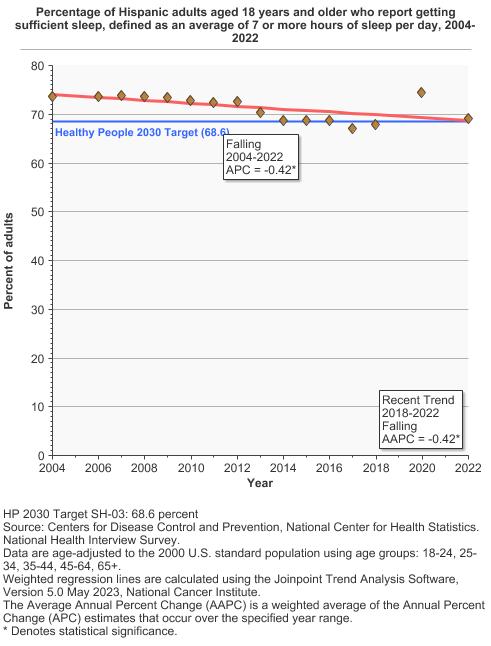
Percentage of adults aged 18 years and older who report getting sufficient sleep, defined as an average of 7 or more hours of sleep per day by race/ethnicity, 2004-2022 Overview Graph Detailed Trend Graphs Most Recent Estimates (2022) Percent of adults 95% Confidence Interval 
All Races/Ethnicities 69.6 68.8 - 70.3 Non-Hispanic White 71.5 70.5 - 72.4 Non-Hispanic Black 61.0 58.9 - 63.2 Hispanic 69.1 67.2 - 70.9 - By Poverty Income Level
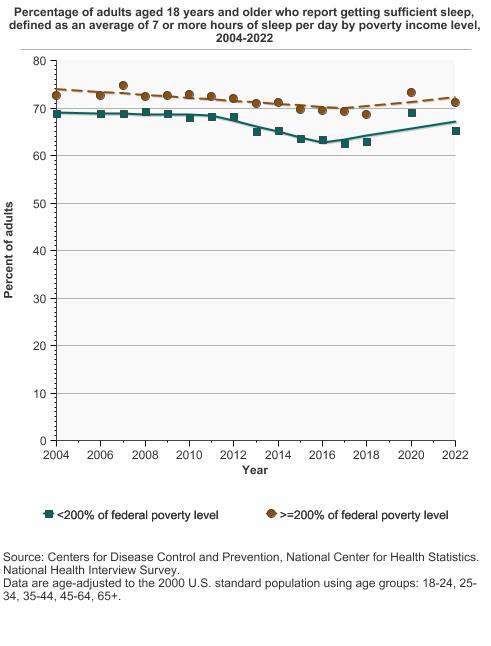
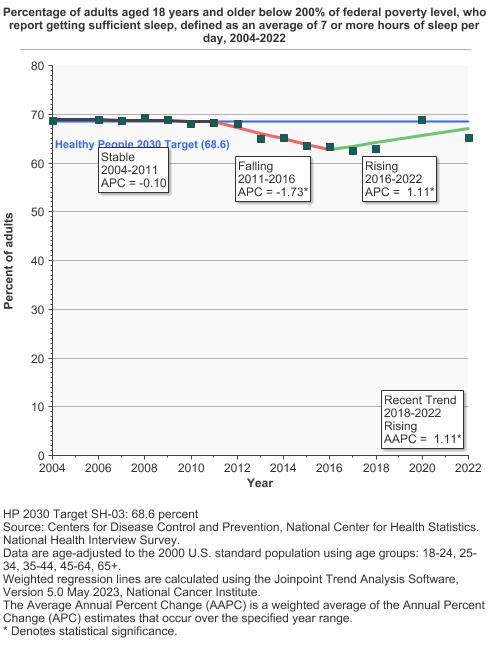
Percentage of adults aged 18 years and older who report getting sufficient sleep, defined as an average of 7 or more hours of sleep per day by poverty income level, 2004-2022 Overview Graph Detailed Trend Graphs Most Recent Estimates (2022) Percent of adults 95% Confidence Interval 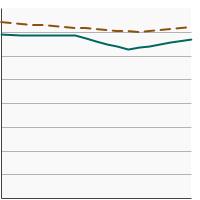
<200% of federal poverty level 65.3 63.8 - 66.7 >=200% of federal poverty level 71.2 70.3 - 72.0 - By Education Level
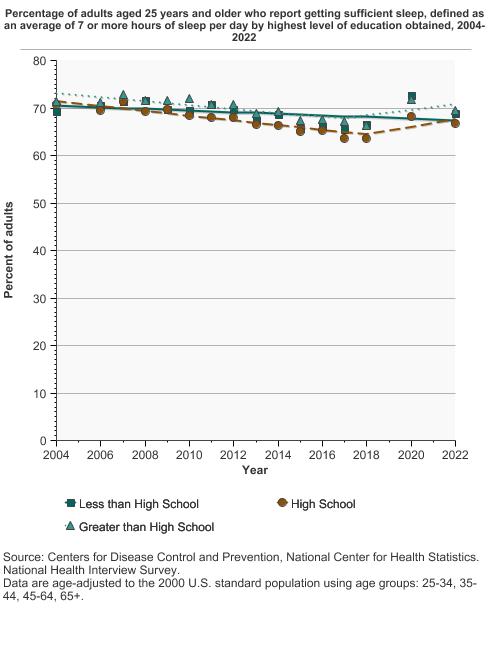
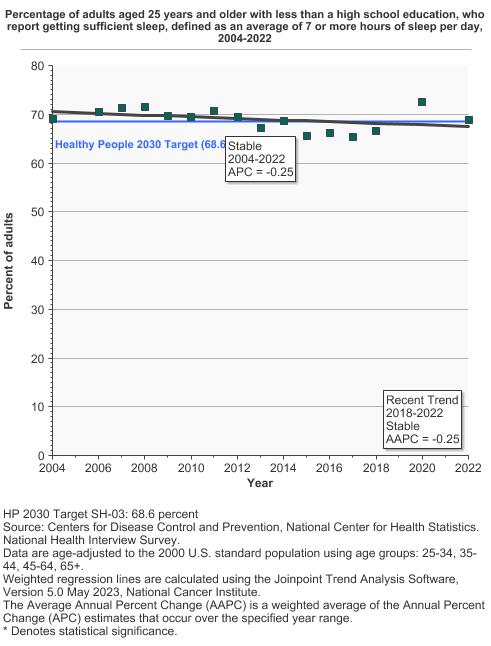
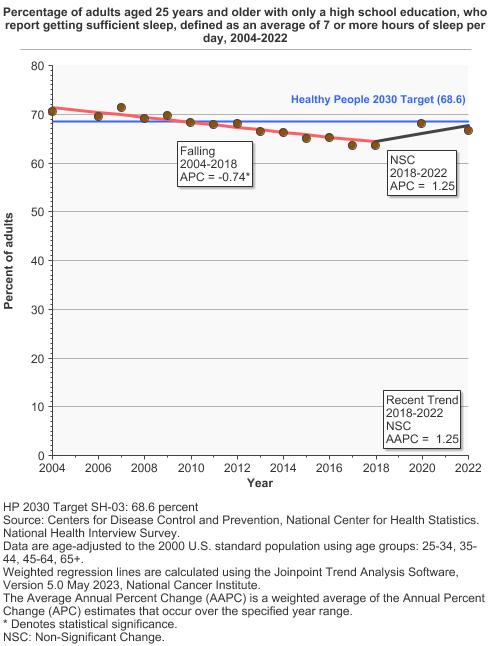
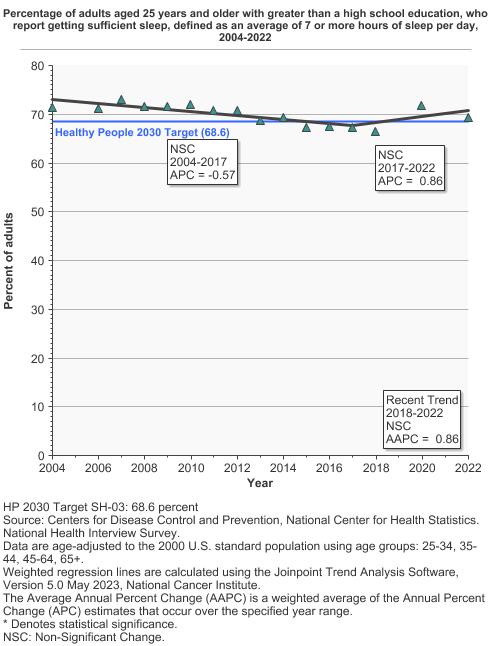
Percentage of adults aged 25 years and older who report getting sufficient sleep, defined as an average of 7 or more hours of sleep per day by highest level of education obtained, 2004-2022 Overview Graph Detailed Trend Graphs Most Recent Estimates (2022) Percent of adults 95% Confidence Interval 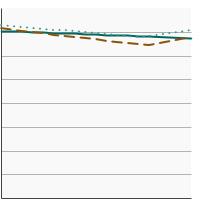
Less than High School 68.9 66.2 - 71.4 High School 66.6 65.0 - 68.2 Greater than High School 69.4 68.5 - 70.3


Additional Information
- Sleep Disturbance. National Cancer Institute.
- Sleep Problems in People with Cancer. National Cancer Institute.
- Sleep and Sleep Disorders. Centers for Disease Control and Prevention.
- Sleep Deprivation and Deficiency. National Heart, Lung, and Blood Institute.
- NIH Sleep Research Plan. National Heart, Lung, and Blood Institute.
- Sleep Disorders (PDQ®)–Health Professional Version. National Cancer Institute.
- Sleep disturbances and the risk of lung cancer: a meta-epidemiological study. Zhou T, Wang Z, Qiao C, et al. BMC Cancer. 2023;23(1):884.
- Sleep duration and risk of all-cause mortality: a systematic review and meta-analysis. García-Perdomo HA, Zapata-Copete J, Rojas-Cerón CA. Epidemiol Psychiatr Sci. 2019;28(5):578-588.
- Association between total sleep time and all cancer mortality: non-linear dose-response meta-analysis of cohort studies. Li Y, Cai S, Ling Y, et al. Sleep Med. 2019;60:211-218.
- Association of Sleep Duration With All- and Major-Cause Mortality Among Adults in Japan, China, Singapore, and Korea. Svensson T, Saito E, Svensson AK, et al. JAMA Network Open. 2021;4(9):e2122837.
- Sleep duration and the risk of cancer: a systematic review and meta-analysis including dose–response relationship. Chen Y, Tan F, Wei L, et al. BMC Cancer. 2018;18(1):1149.
- Relationship of Sleep Duration With All‐Cause Mortality and Cardiovascular Events: A Systematic Review and Dose‐Response Meta‐Analysis of Prospective Cohort Studies. Yin J, Jin X, Shan Z, et al. J Am Heart Assoc. 2017;6(9):e005947.
- Sleep duration and risk of overall and 22 site-specific cancers: A Mendelian randomization study. Titova OE, Michaëlsson K, Vithayathil M, et al. Int J Cancer. 2021;148(4):914-920.
- Associations Among Sleep and Cancer Risk Behaviors: a Scoping Review of Experimental Studies in Healthy Adult Populations. Taber JM, Cribbet MR, Cadmus-Bertram L, et al. Int J Behav Med. 2021; 28: 162–176.
- Recommended Amount of Sleep for a Healthy Adult: A Joint Consensus Statement of the American Academy of Sleep Medicine and Sleep Research Society. Watson NF, Badr MS, Belenky G, et al. Sleep. 2015;38(6):843-844.
- Sleep Facts and Stats. Centers for Disease Control and Prevention.