On This Page:
- Background
- Measure
- Healthy People 2030 Target
- Data Source
- Trends and Most Recent Estimates
- Additional Information
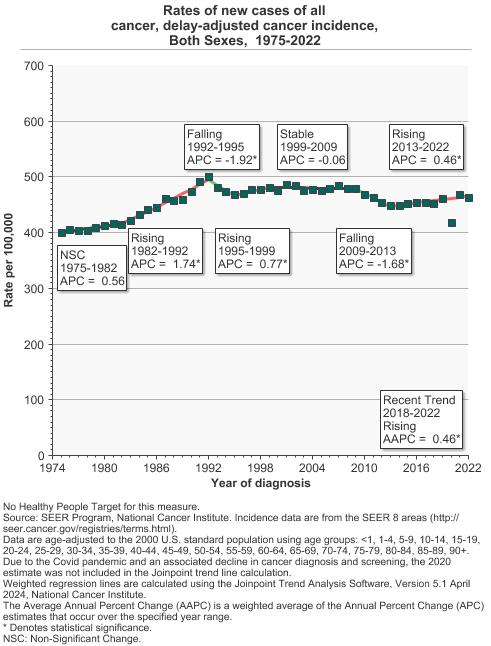
In 2022, the rate of new cases of all cancers combined was 462.8 per 100,000 people per year.
Background
Cancer incidence is typically measured as the number of new cases each year for every 100,000 people (for sex-specific cancers, people of the same sex serve as the denominator) and age-adjusted to a standard population to allow comparisons over time.
In 2025, nearly half of all new cancer cases are expected to be cancers of the prostate, breast, lung, and colon and rectum. According to American Cancer Society projections, about 2,041,910 new cases of cancer are expected to be diagnosed in 2025, including 313,780 cases of prostate cancer, 319,750 cases of breast cancer, 226,650 cases of lung and bronchus cancer, and 154,270 cases of colorectal cancer.
Measure
Incidence rate: the observed number of new cancer cases per 100,000 people per year, adjusted for age and cancer case reporting delays and based on data from approximately 45.8 percent of the U.S. population.
Delay adjustment: a method of estimating delayed reporting of incident cases and then adjusting rates to account for this delay.
Trend lines: calculated from the underlying rates using the Joinpoint Trend Analysis Software.
The 2020 incidence rate is displayed but not used in the fit of the trends line(s). Impact of COVID on SEER Incidence 2020 data.
Data Source
SEER Program, National Cancer Institute, 1975–2022.
Healthy People 2030 Target
There are no Healthy People 2030 targets for cancer incidence.
Healthy People 2030 is a set of goals set forth by the Department of Health and Human Services.
Trends and Most Recent Estimates
- All Cancer Sites Combined
- By Sex
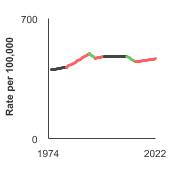
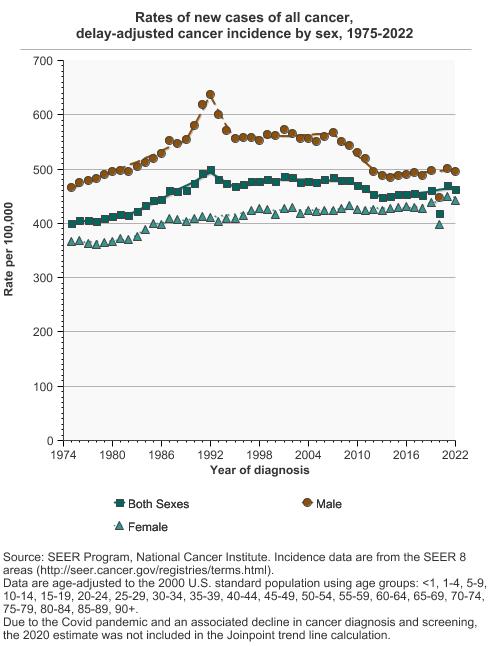
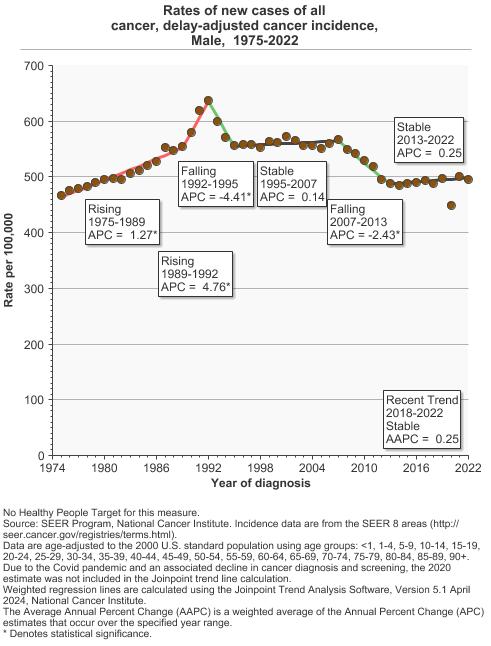
Rates of new cases of all cancer, delay-adjusted cancer incidence by sex, 1975-2022 Overview Graph Detailed Trend Graphs Most Recent Estimates (2022) Rate per 100,000 95% Confidence Interval 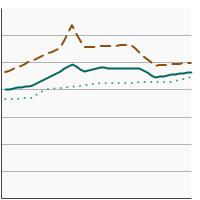

Both Sexes 
462.8 460.4 - 465.2 Male 495.5 491.8 - 499.1 Female 442.4 439.1 - 445.7 - By Race/Ethnicity
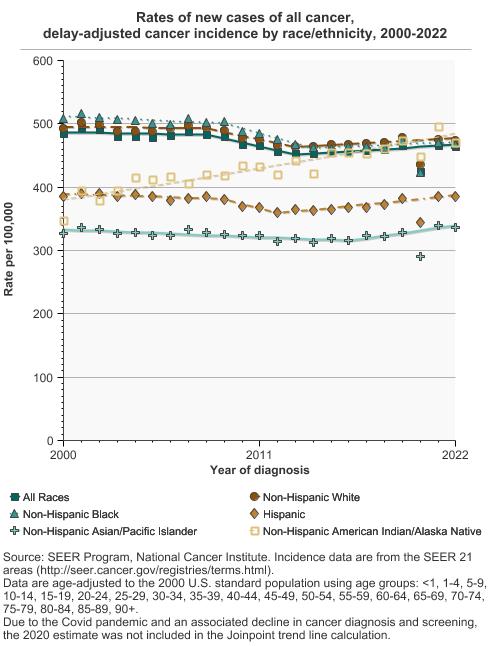
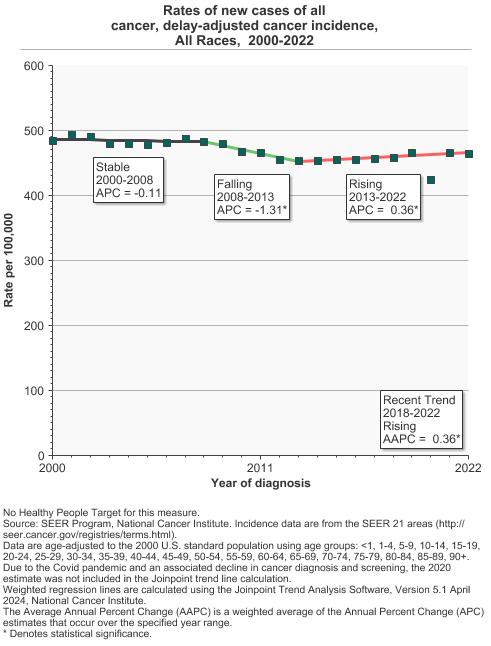
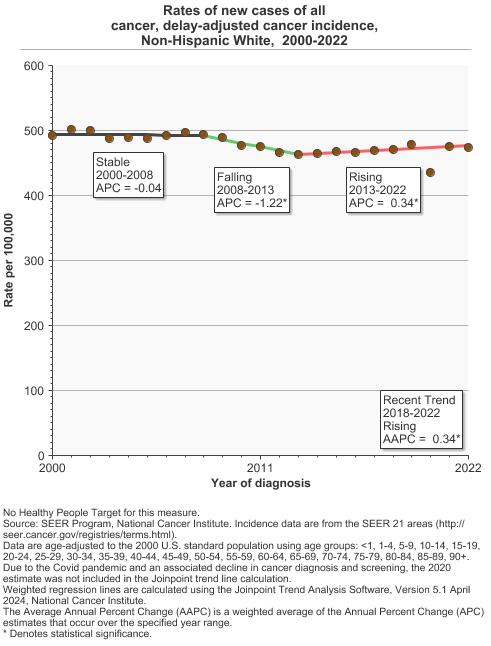
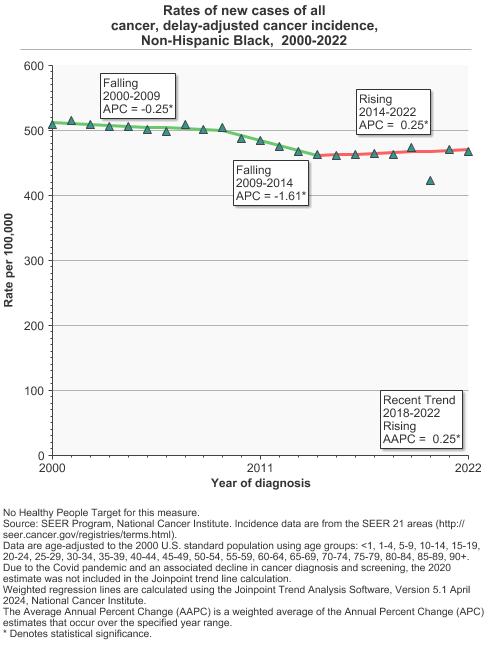
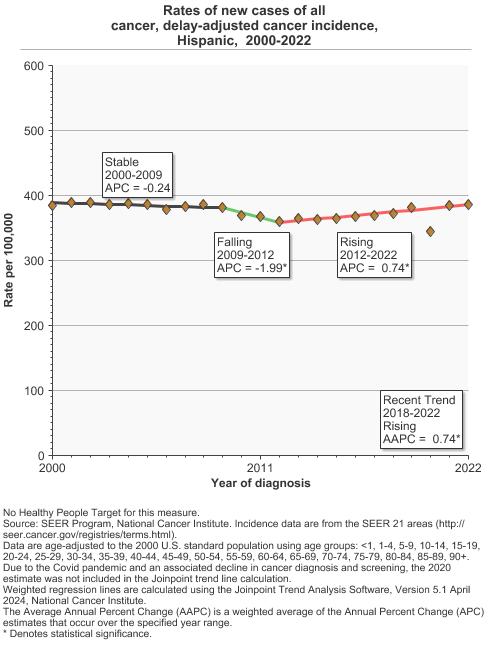
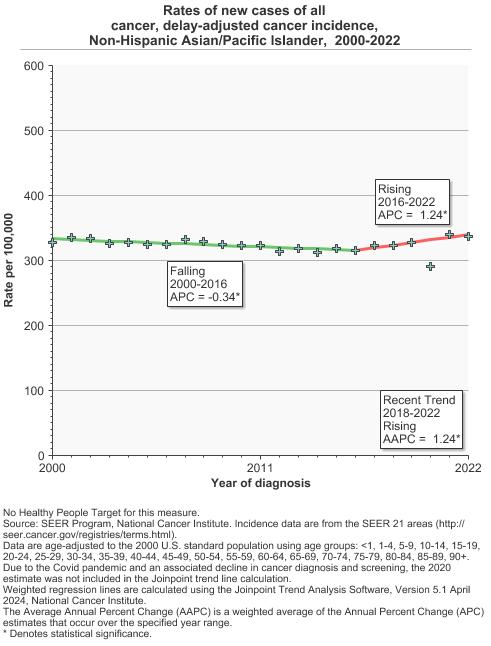
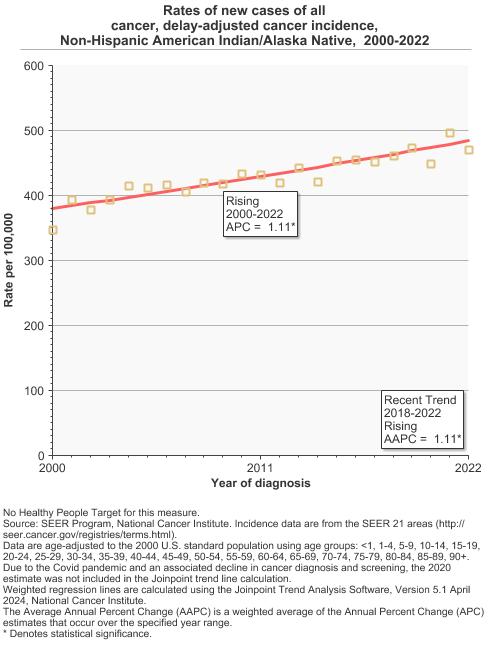
Rates of new cases of all cancer, delay-adjusted cancer incidence by race/ethnicity, 2000-2022 Overview Graph Detailed Trend Graphs Most Recent Estimates (2022) Rate per 100,000 95% Confidence Interval 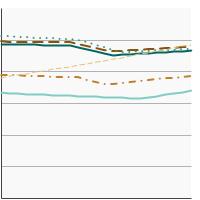
All Races 464.4 463.3 - 465.4 Non-Hispanic White 474.2 473.0 - 475.4 Non-Hispanic Black 467.3 464.2 - 470.4 Hispanic 385.5 383.2 - 387.8 Non-Hispanic Asian/Pacific Islander 336.6 333.7 - 339.5 Non-Hispanic American Indian/Alaska Native 470.9 452.2 - 490.1
- Top 4 Cancer Sites
- Comparison of Top Cancer Sites
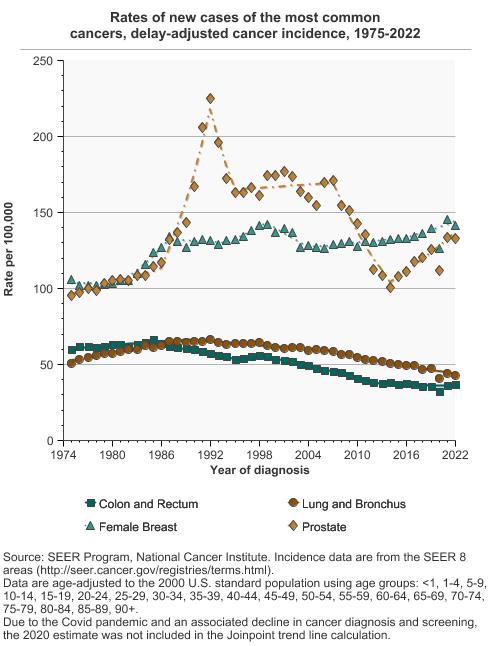
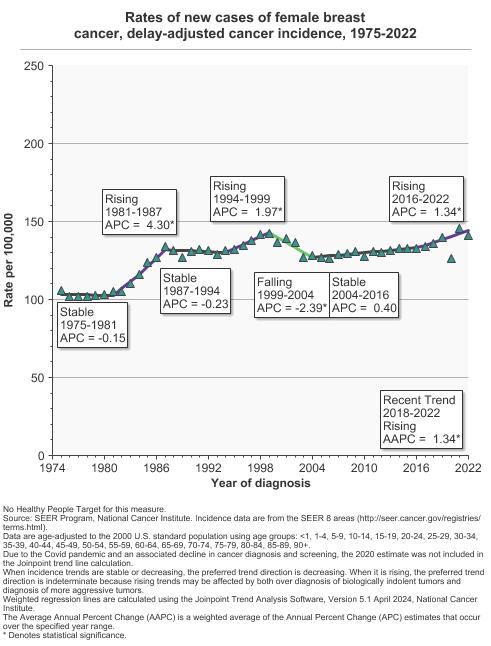
Rates of new cases of the most common cancers, delay-adjusted cancer incidence, 1975-2022 Overview Graph Detailed Trend Graphs Most Recent Estimates (2022) Rate per 100,000 95% Confidence Interval 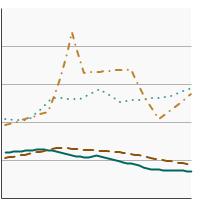
Colon and Rectum 36.6 35.9 - 37.3 Lung and Bronchus 42.8 42.1 - 43.5 Female Breast 141.3 139.4 - 143.2 Prostate 133.1 131.3 - 134.9 - Colon and Rectum Cancer by Sex
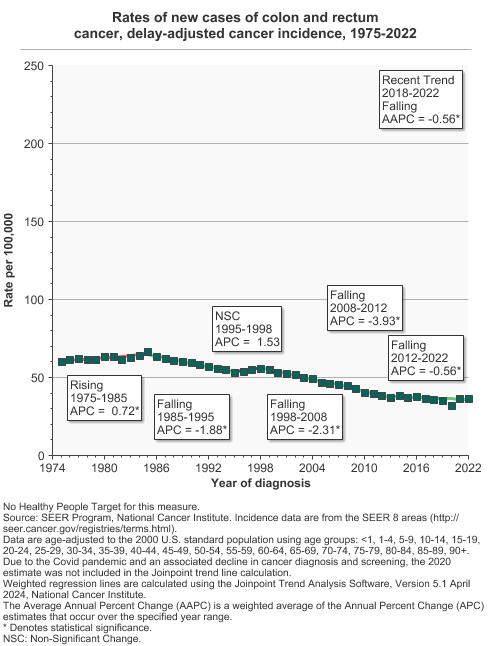
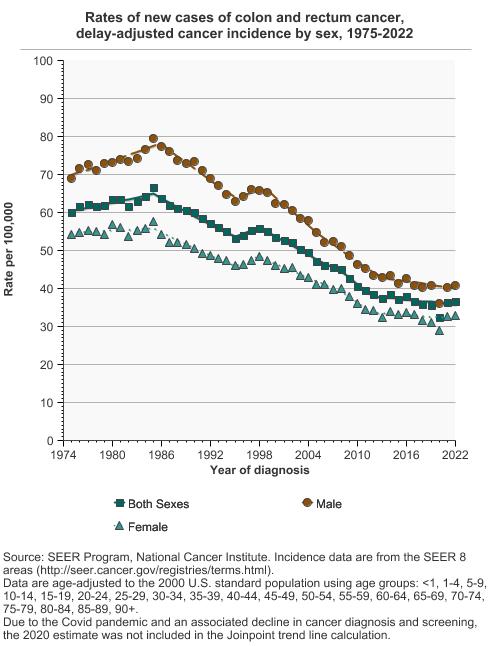
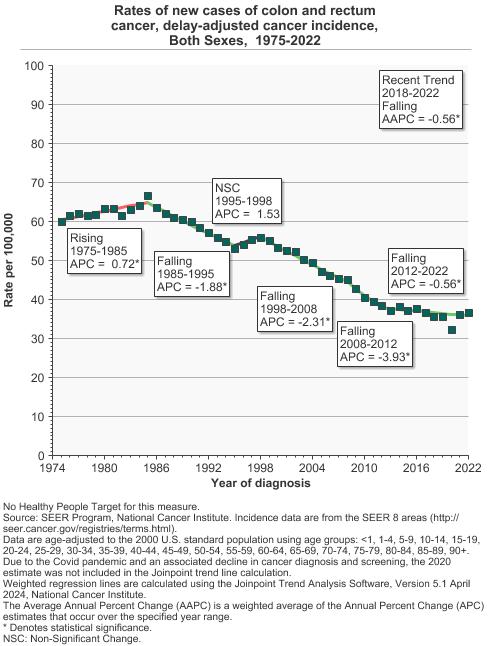
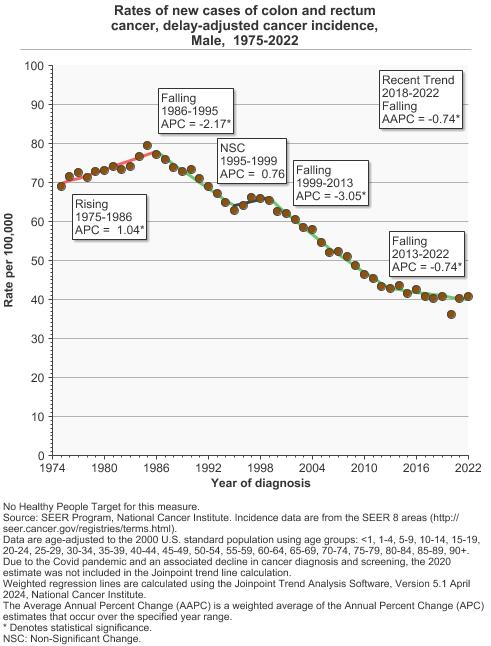
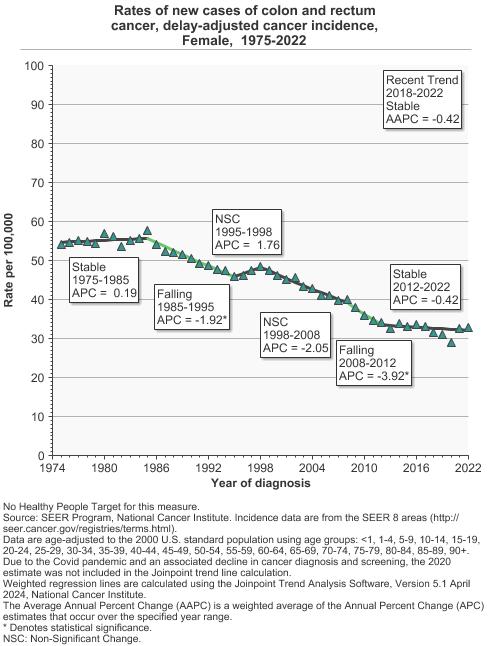
Rates of new cases of colon and rectum cancer, delay-adjusted cancer incidence by sex, 1975-2022 Overview Graph Detailed Trend Graphs Most Recent Estimates (2022) Rate per 100,000 95% Confidence Interval 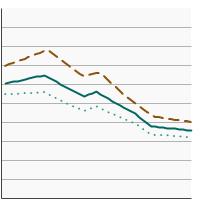
Both Sexes 36.6 35.9 - 37.3 Male 40.8 39.7 - 41.8 Female 32.8 31.9 - 33.8 - Colon and Rectum Cancer by Race/Ethnicity
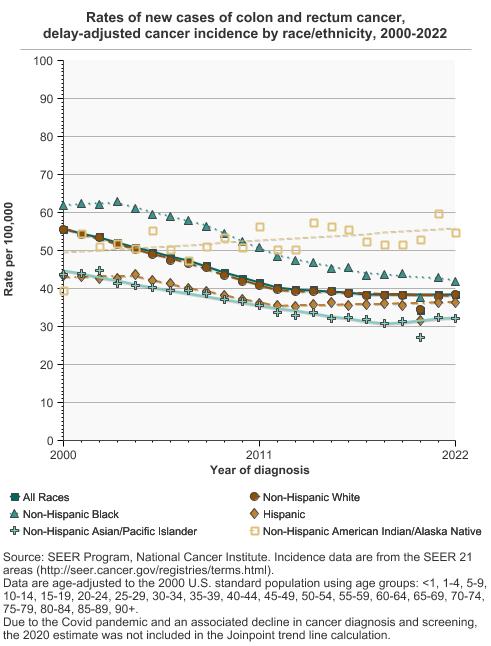
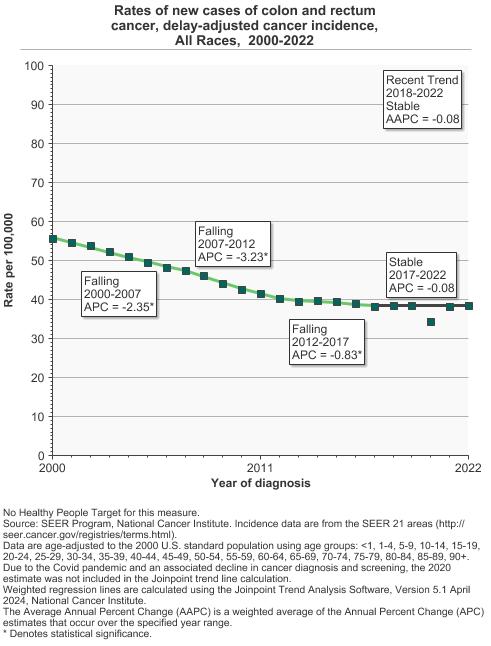
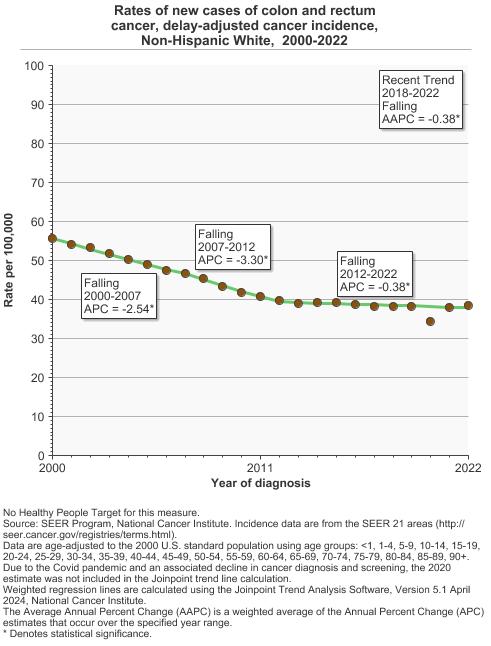
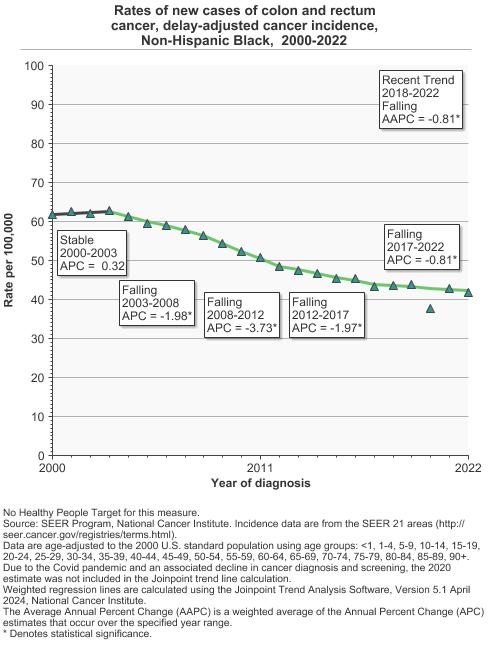
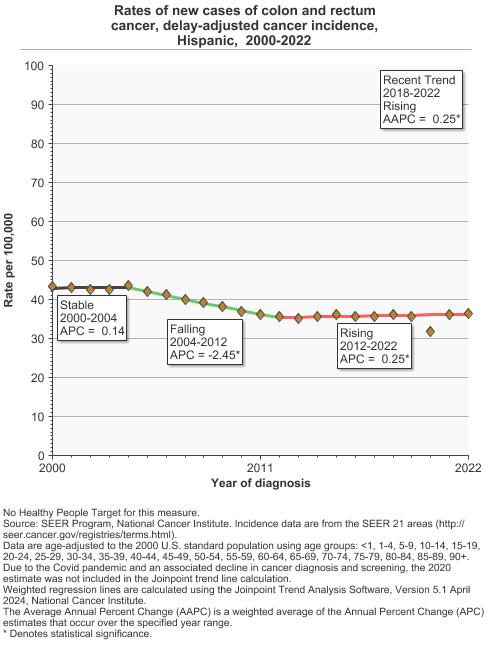
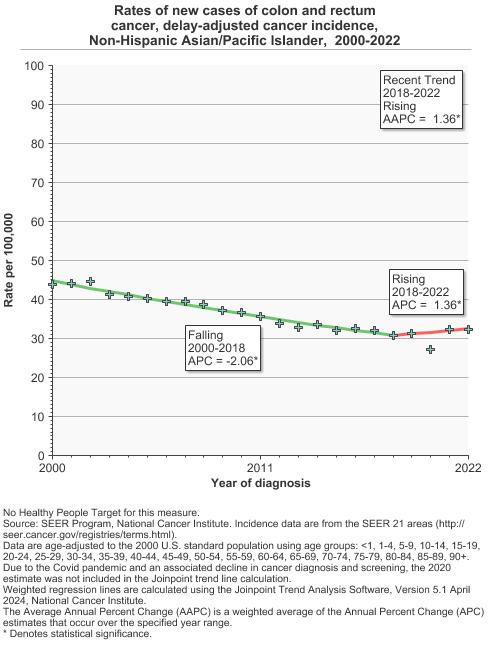
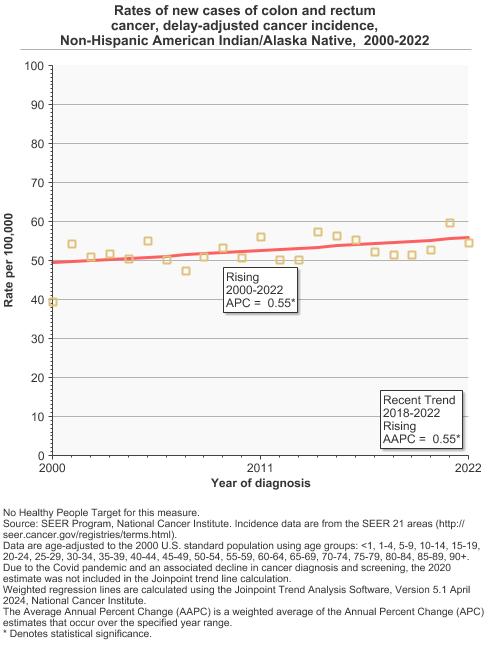
Rates of new cases of colon and rectum cancer, delay-adjusted cancer incidence by race/ethnicity, 2000-2022 Overview Graph Detailed Trend Graphs Most Recent Estimates (2022) Rate per 100,000 95% Confidence Interval 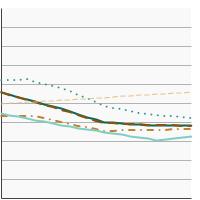
All Races 38.5 38.2 - 38.8 Non-Hispanic White 38.4 38.0 - 38.7 Non-Hispanic Black 41.7 40.8 - 42.7 Hispanic 36.4 35.7 - 37.1 Non-Hispanic Asian/Pacific Islander 32.2 31.3 - 33.1 Non-Hispanic American Indian/Alaska Native 54.7 48.4 - 61.6 - Lung and Bronchus Cancer by Sex
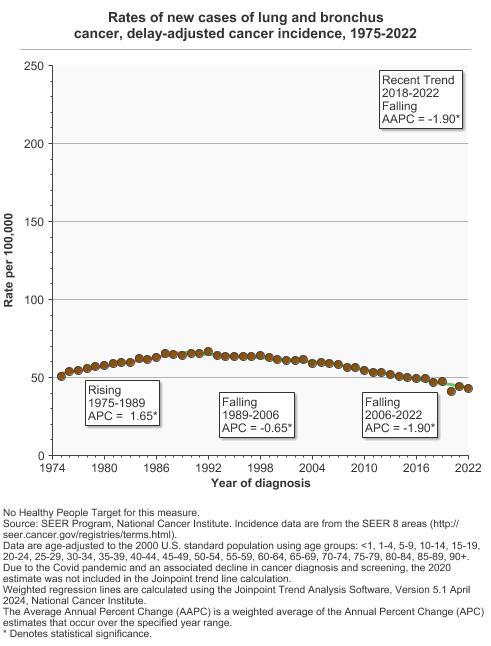
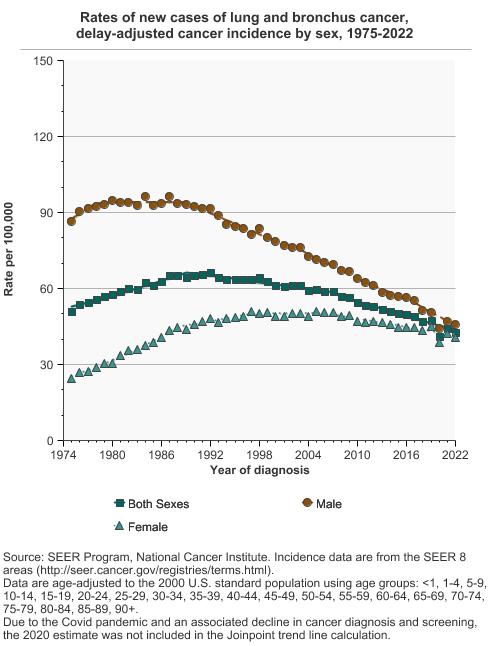
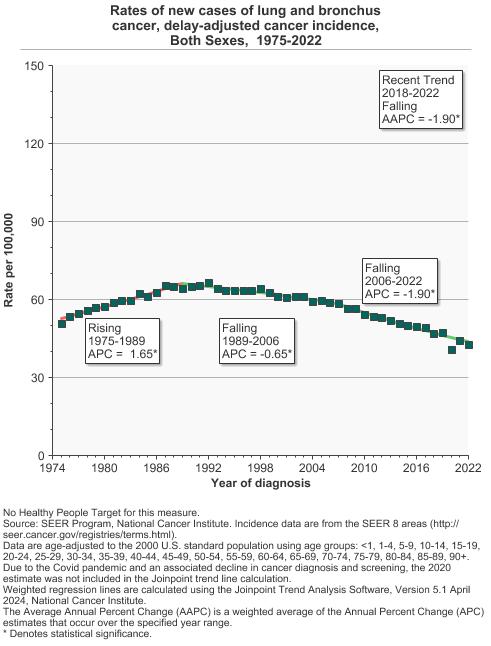
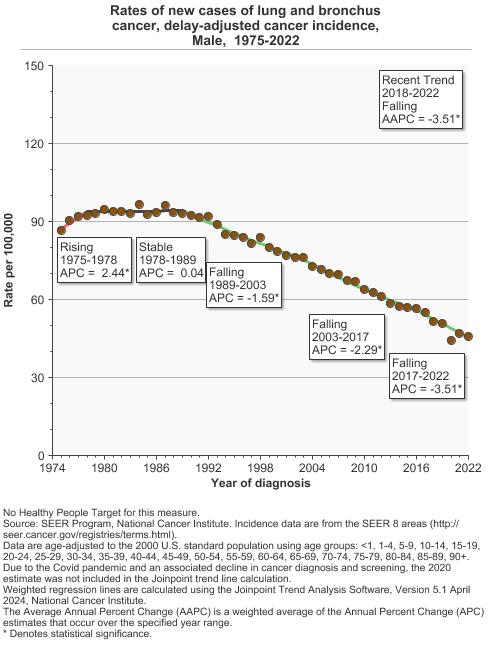
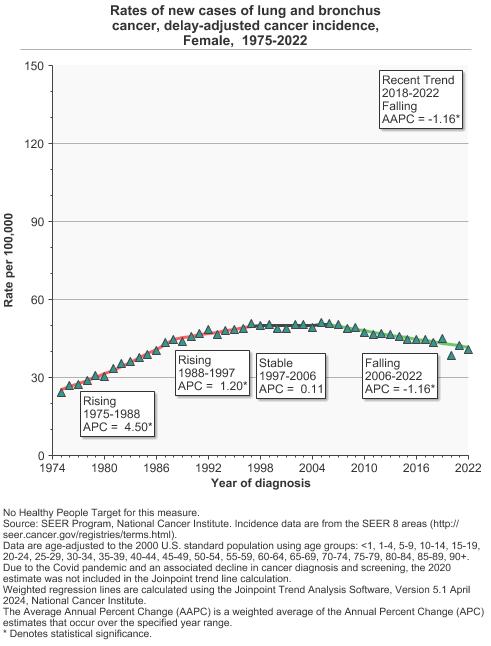
Rates of new cases of lung and bronchus cancer, delay-adjusted cancer incidence by sex, 1975-2022 Overview Graph Detailed Trend Graphs Most Recent Estimates (2022) Rate per 100,000 95% Confidence Interval 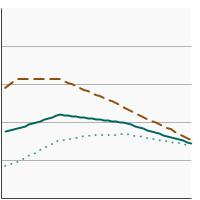
Both Sexes 42.8 42.1 - 43.5 Male 45.8 44.7 - 46.9 Female 40.8 39.8 - 41.7 - Lung and Bronchus Cancer by Race/Ethnicity
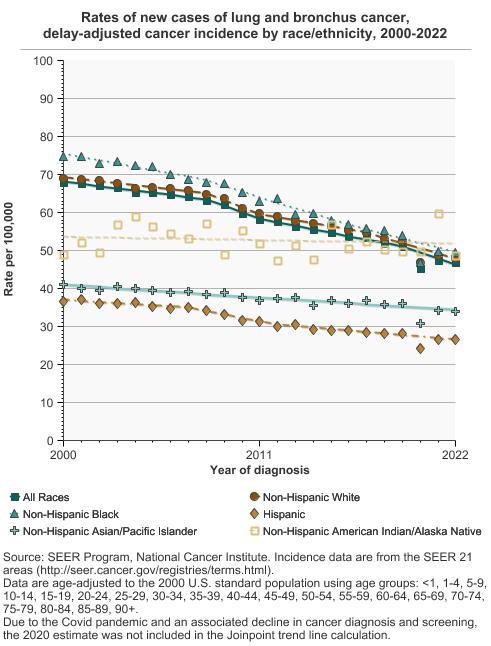
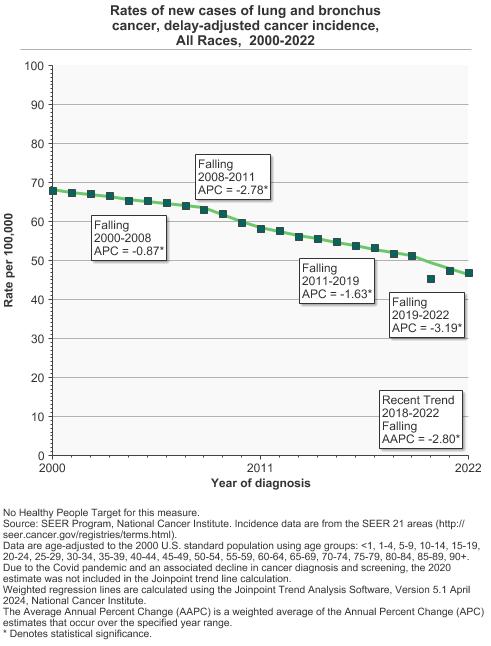
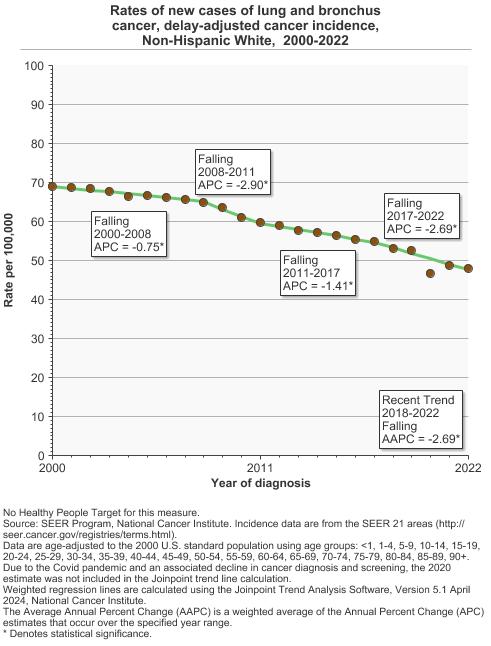
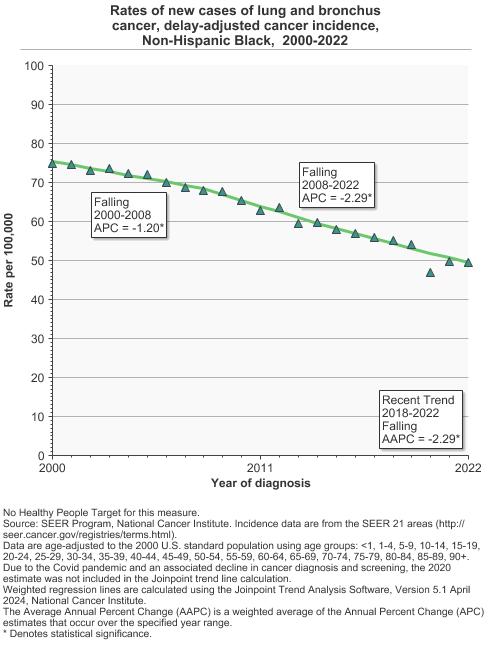
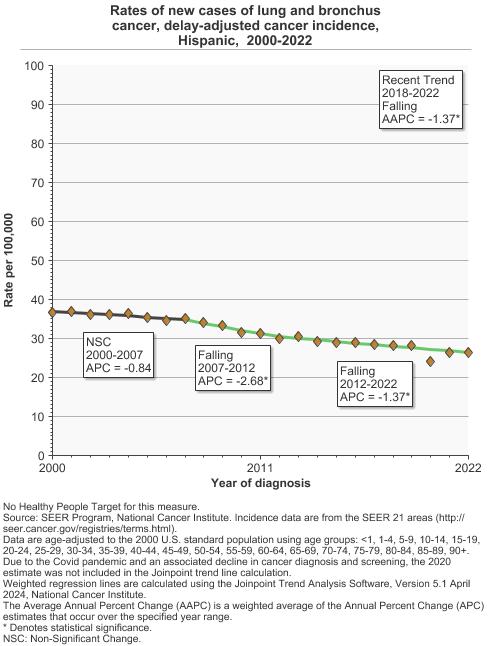
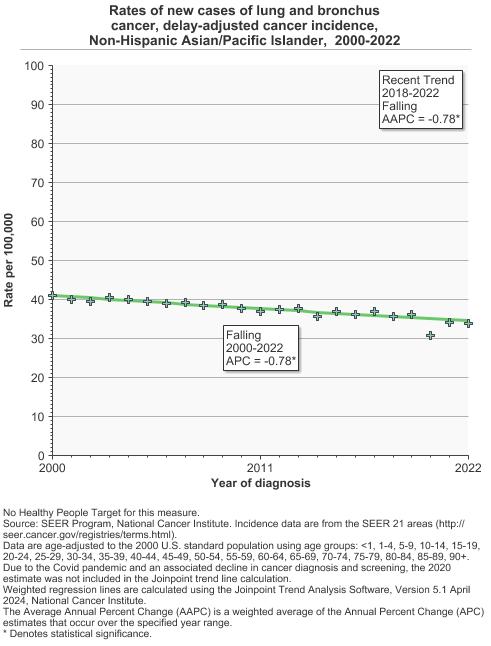
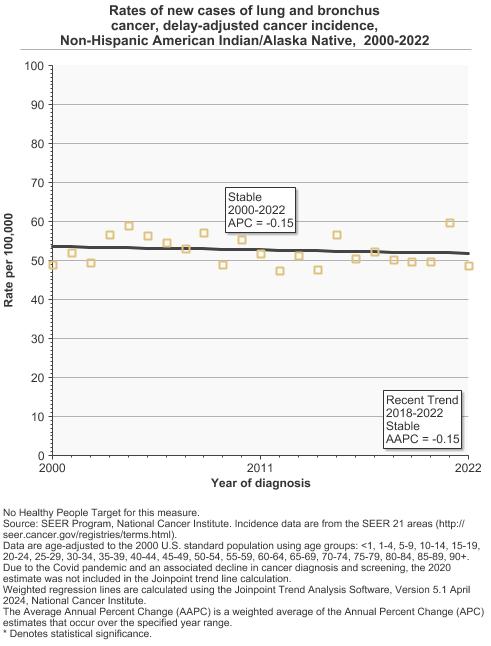
Rates of new cases of lung and bronchus cancer, delay-adjusted cancer incidence by race/ethnicity, 2000-2022 Overview Graph Detailed Trend Graphs Most Recent Estimates (2022) Rate per 100,000 95% Confidence Interval 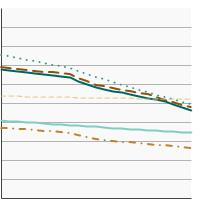
All Races 46.8 46.5 - 47.1 Non-Hispanic White 47.9 47.6 - 48.3 Non-Hispanic Black 49.4 48.4 - 50.4 Hispanic 26.5 25.8 - 27.1 Non-Hispanic Asian/Pacific Islander 33.9 33.0 - 34.8 Non-Hispanic American Indian/Alaska Native 48.6 42.9 - 54.8 - Female Breast Cancer by Race/Ethnicity
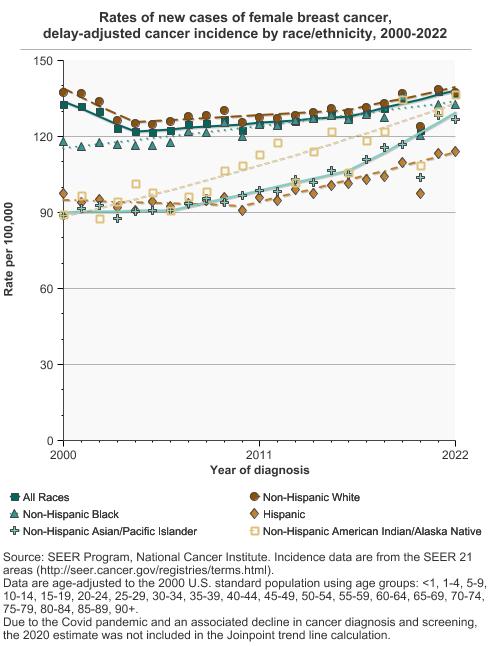
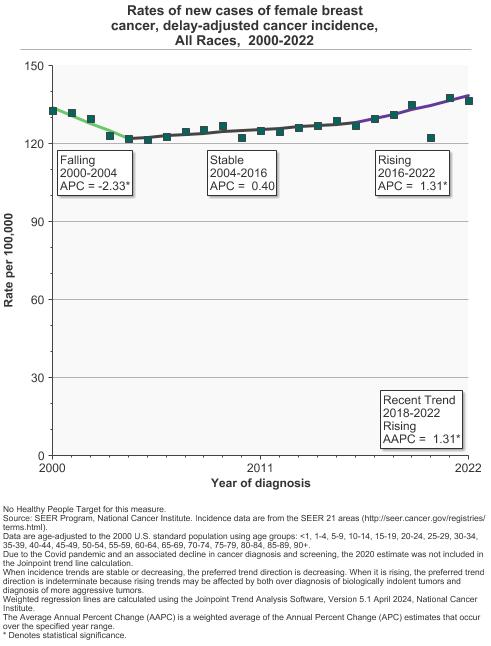
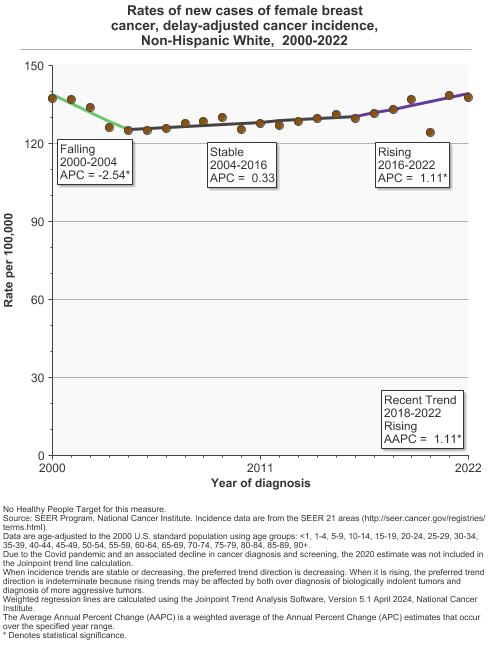
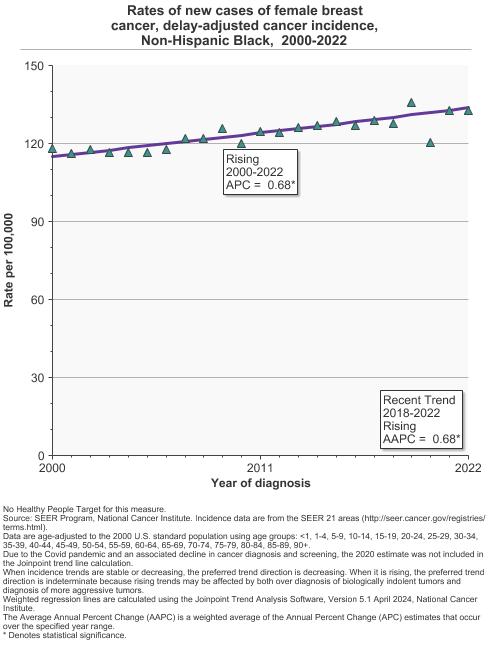
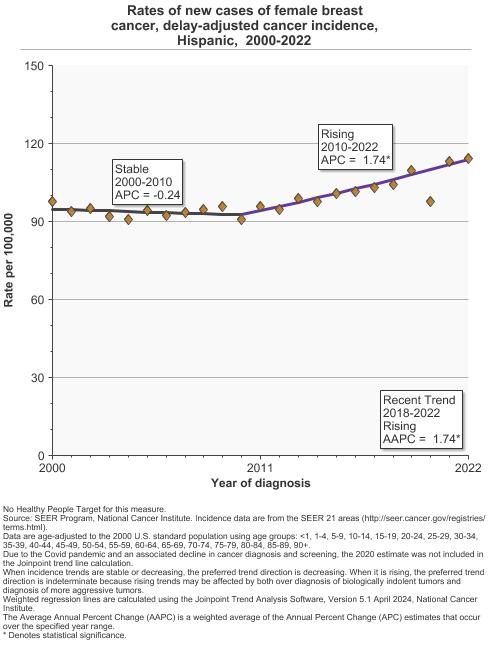
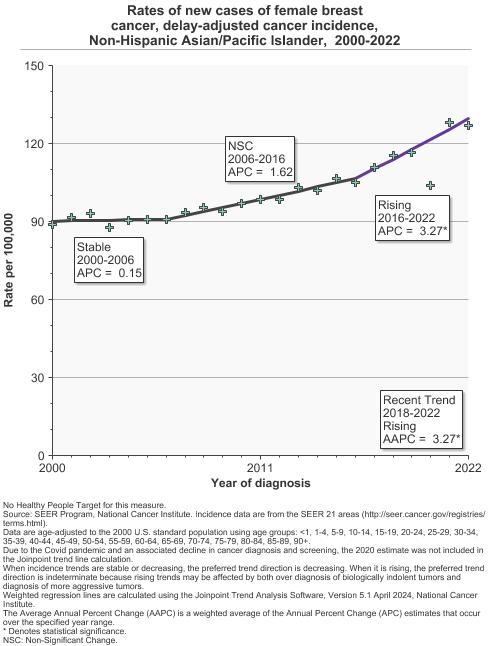
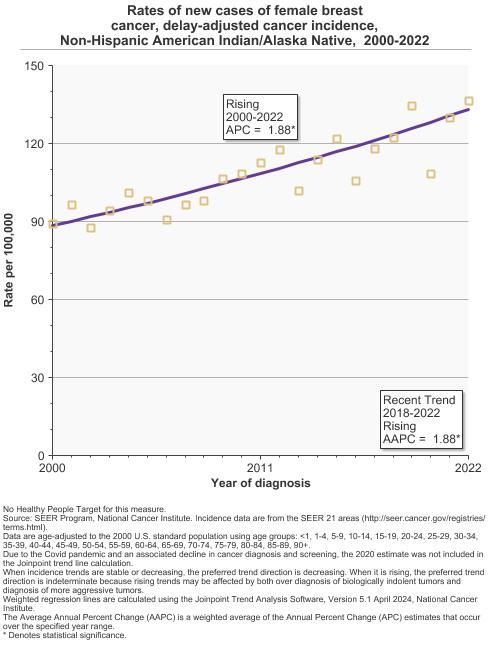
Rates of new cases of female breast cancer, delay-adjusted cancer incidence by race/ethnicity, 2000-2022 Overview Graph Detailed Trend Graphs Most Recent Estimates (2022) Rate per 100,000 95% Confidence Interval 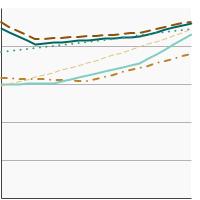
All Races 136.5 135.7 - 137.3 Non-Hispanic White 137.5 136.6 - 138.4 Non-Hispanic Black 132.7 130.5 - 134.9 Hispanic 114.1 112.4 - 115.7 Non-Hispanic Asian/Pacific Islander 126.9 124.5 - 129.3 Non-Hispanic American Indian/Alaska Native 136.4 123.1 - 150.8 - Prostate Cancer by Race/Ethnicity
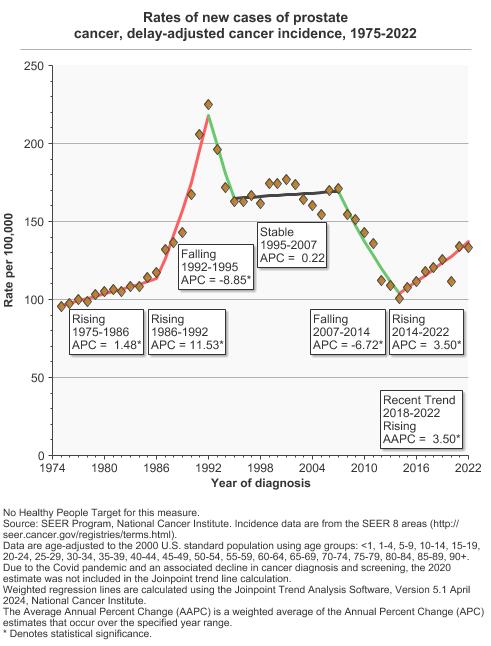
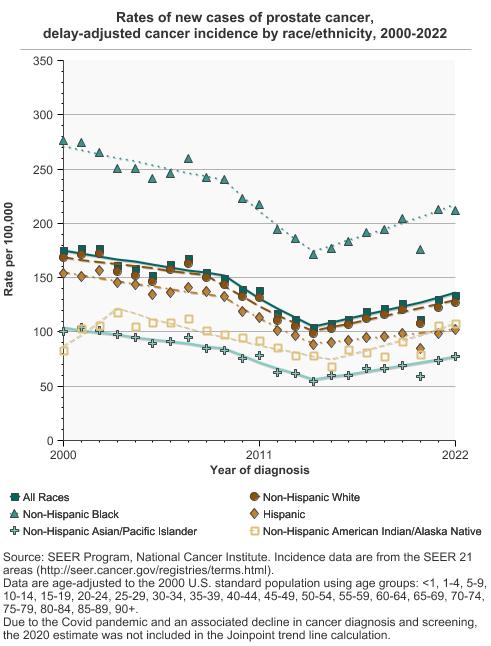
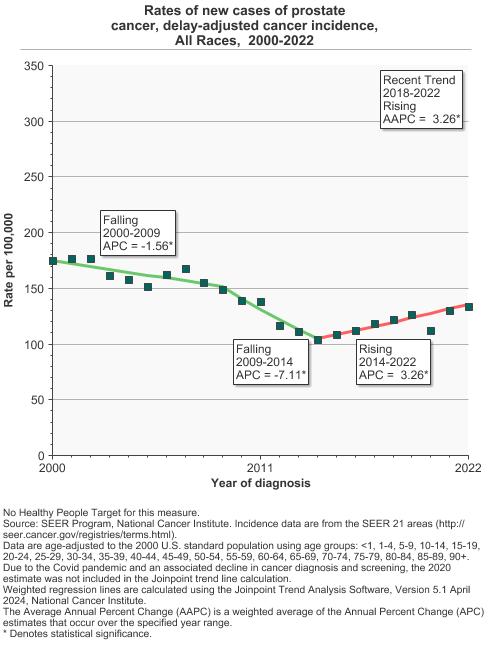
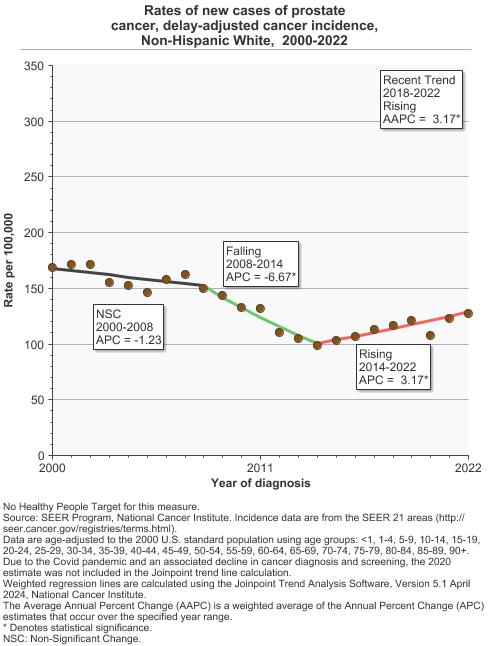
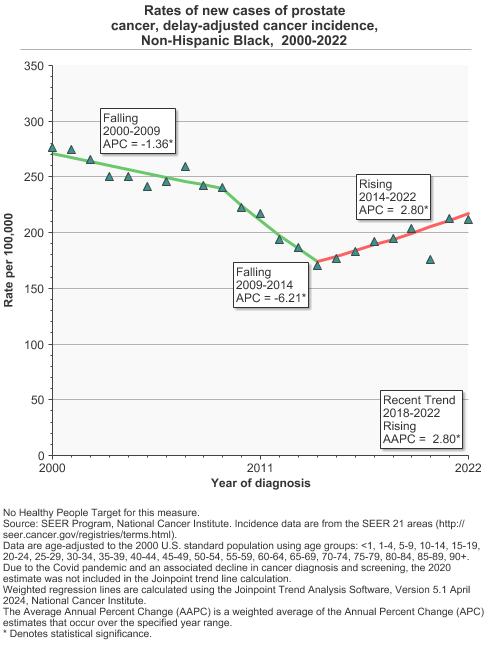
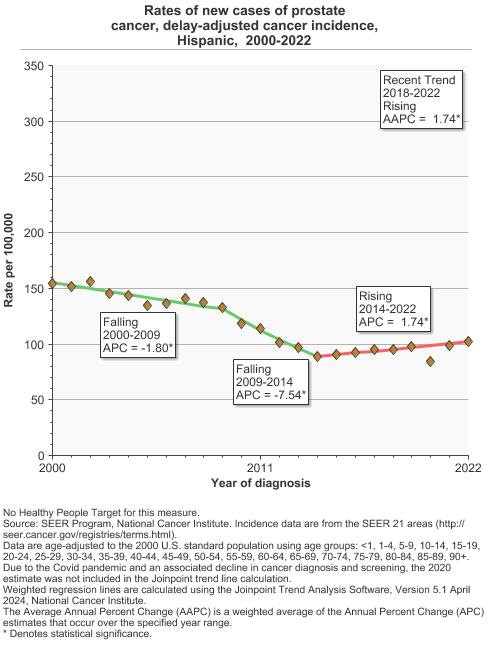
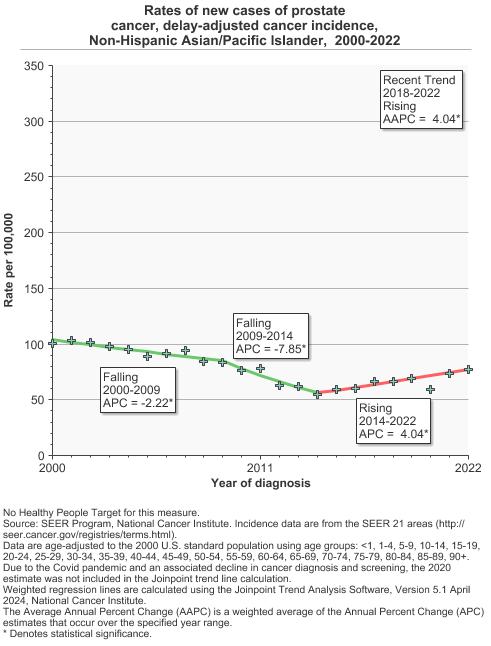
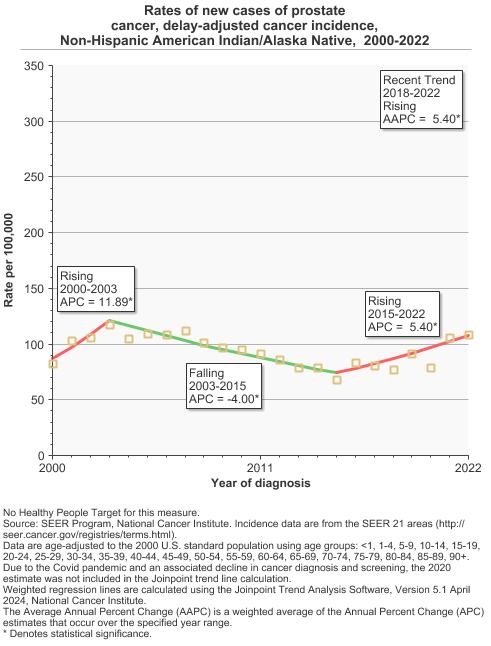
Rates of new cases of prostate cancer, delay-adjusted cancer incidence by race/ethnicity, 2000-2022 Overview Graph Detailed Trend Graphs Most Recent Estimates (2022) Rate per 100,000 95% Confidence Interval 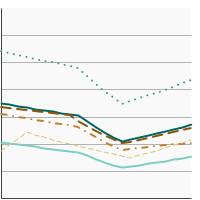
All Races 133.6 132.8 - 134.4 Non-Hispanic White 127.2 126.3 - 128.1 Non-Hispanic Black 211.9 208.8 - 215.2 Hispanic 102.4 100.5 - 104.2 Non-Hispanic Asian/Pacific Islander 77.2 75.1 - 79.3 Non-Hispanic American Indian/Alaska Native 108.2 94.8 - 122.9
- Recent Trends for Common Cancer Sites
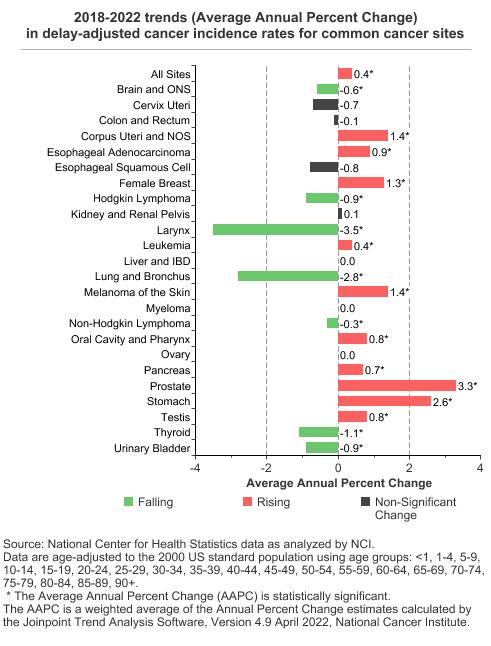
2018-2022 trends (Average Annual Percent Change) in delay-adjusted cancer incidence rates for common cancer sites Overview graph Cancer Site Average Annual Percent Change 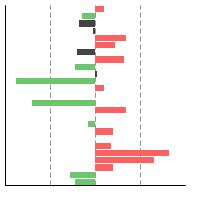
All Sites 0.4* Brain and ONS -0.6* Cervix Uteri -0.7 Colon and Rectum -0.1 Corpus Uteri and NOS 1.4* Esophageal Adenocarcinoma 0.9* Esophageal Squamous Cell -0.8 Female Breast 1.3* Hodgkin Lymphoma -0.9* Kidney and Renal Pelvis 0.1 Larynx -3.5* Leukemia 0.4* Liver and IBD 0.0 Lung and Bronchus -2.8* Melanoma of the Skin 1.4* Myeloma 0.0 Non-Hodgkin Lymphoma -0.3* Oral Cavity and Pharynx 0.8* Ovary 0.0 Pancreas 0.7* Prostate 3.3* Stomach 2.6* Testis 0.8* Thyroid -1.1* Urinary Bladder -0.9* * The Average Annual Percent Change (AAPC) is statistically significant.

Additional Information
- Cancer Incidence Rates. National Cancer Institute.
- Common Cancer Types. National Cancer Institute.
- Learn About Cancer. American Cancer Society.
- Resources for Health Professionals. National Cancer Institute.
- Cancer Facts and Figures. American Cancer Society.
- Annual Report to the Nation on the Status of Cancer. National Cancer Institute.
- Cancer Statistics, 2025. Siegel RL, Kratzer TB, Giaquinto AN, Sung H, Jemal A. CA: A Cancer Journal for Clinicians. 2025;75(01):10-45.
- State Cancer Profiles. National Cancer Institute, and Centers for Disease Control and Prevention.
- United States Cancer Statistics: Data Visualizations. National Cancer Institute, and Centers for Disease Control and Prevention.
- United States Cancer Statistics – Interpreting Incidence Data. National Cancer Institute, and Centers for Disease Control and Prevention.
- SEER*Explorer: An interactive website that provides easy access to a wide range of SEER cancer statistics. National Cancer Institute.
- WONDER Online Databases – United States Cancer Statistics. Centers for Disease Control and Prevention.