On This Page:
- Background
- Measure
- Healthy People 2030 Target
- Data Source
- Trends and Most Recent Estimates
- Related Cancers
- Additional Information
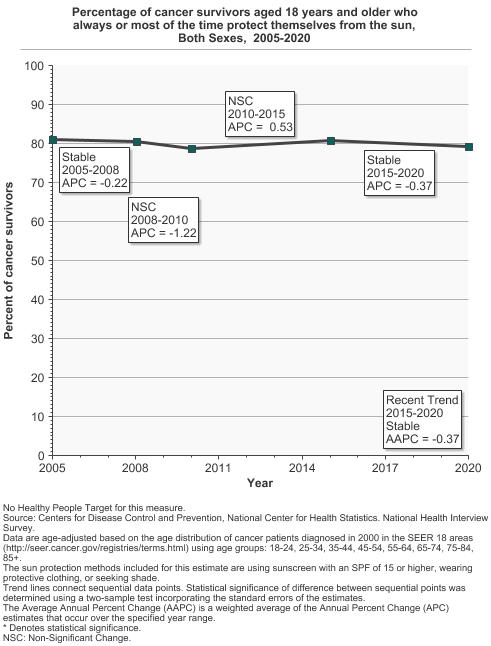
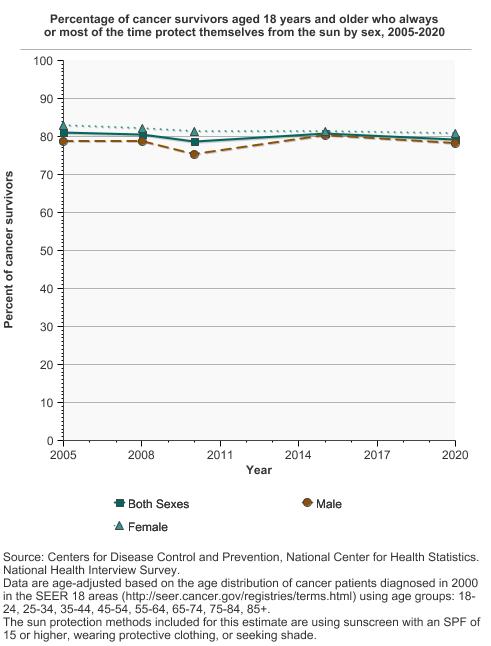
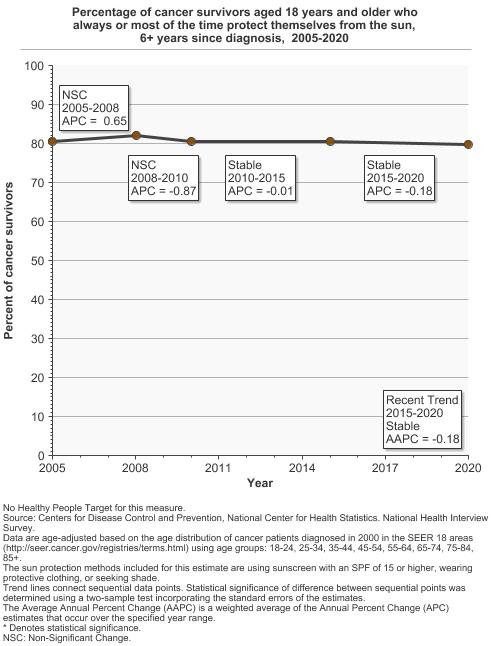
In 2020, 79.2% of adult cancer survivors said they usually or always protect themselves from the sun by practicing at least one of three sun protection behaviors.
Background
Measure
Rates reported for cancer survivors are based on the self-reporting of individuals with a cancer history who are interviewed as part of the annual population-based National Health Interview Survey (NHIS).
The percentage of cancer survivors aged 18 years and older who reported that they usually or always practice at least one of three sun-protective behaviors - using sunscreen, wearing protective clothing (a long-sleeve shirt, and/or wide brimmed hat shading the face, ears, and neck, and/or long pants/long skirt), or seeking shade when going outside on a sunny day for more than an hour.
The percentage of cancer survivors aged 18 years and older who have used an indoor tanning device one or more times during the past 12 months.
The percentage of cancer survivors aged 18 years and older who reported having been sunburned in the past 12 months.
Data Source
Centers for Disease Control and Prevention, National Center for Health Statistics. National Health Interview Survey NCI and CDC co-sponsored Cancer Control Supplement, 2005–2020.
Refer to the Data Sources page for more information about data collection years 2019+.
Healthy People 2030 Target
- There are no Healthy People 2030 targets regarding protective measures that may reduce the risk of skin cancer, indoor tanning or sunburn.
Healthy People 2030 is a set of goals set forth by the Department of Health and Human Services.
Trends and Most Recent Estimates
- Sun Protection
- By Sex
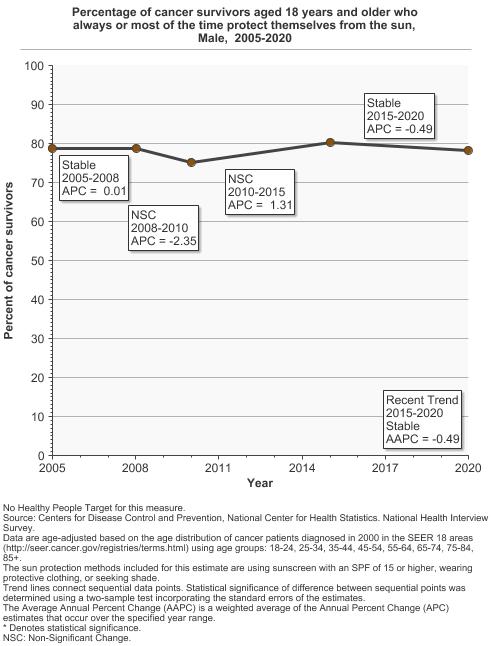
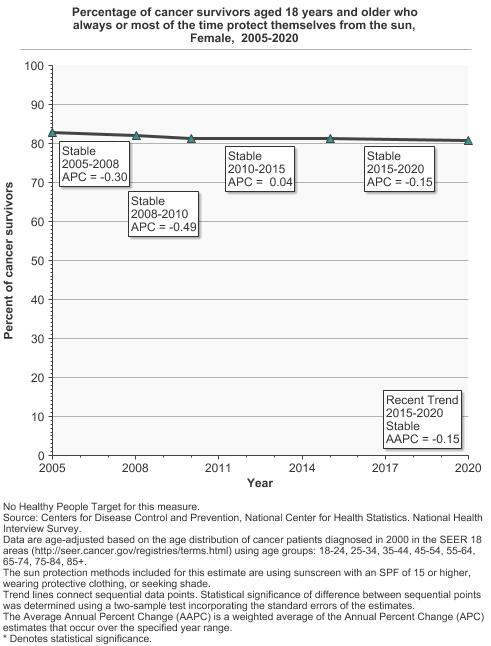
Percentage of cancer survivors aged 18 years and older who always or most of the time protect themselves from the sun by sex, 2005-2020 Overview Graph Detailed Trend Graphs Most Recent Estimates (2020) Percent of cancer survivors 95% Confidence Interval 

Both Sexes 
79.2 77.3 - 81.1 Male 78.2 75.3 - 80.9 Female 80.8 78.2 - 83.2 - By Age
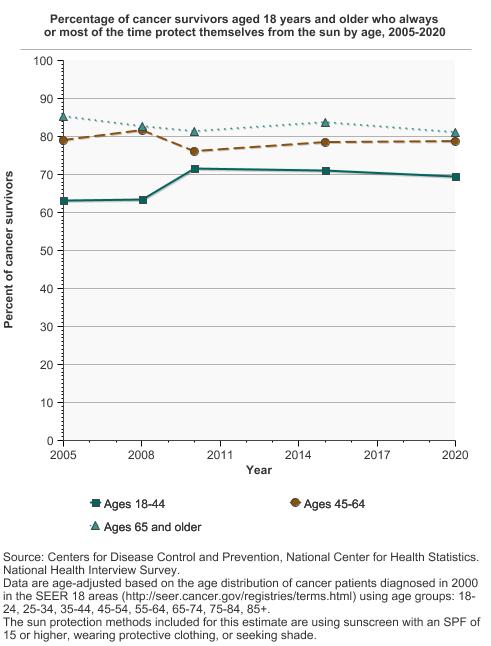
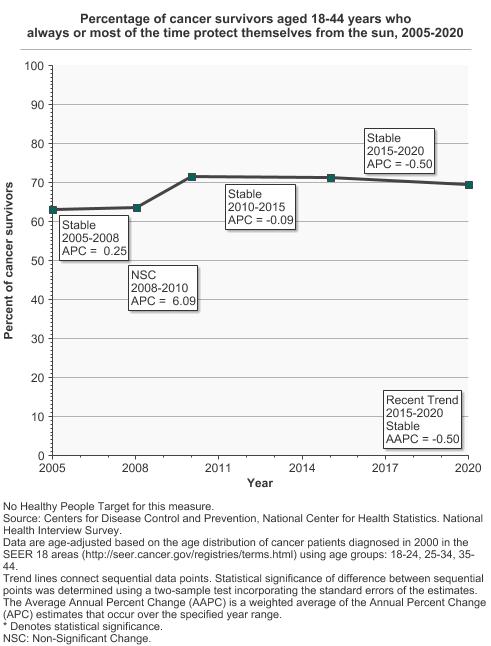
Percentage of cancer survivors aged 18 years and older who always or most of the time protect themselves from the sun by age, 2005-2020 Overview Graph Detailed Trend Graphs Most Recent Estimates (2020) Percent of cancer survivors 95% Confidence Interval 
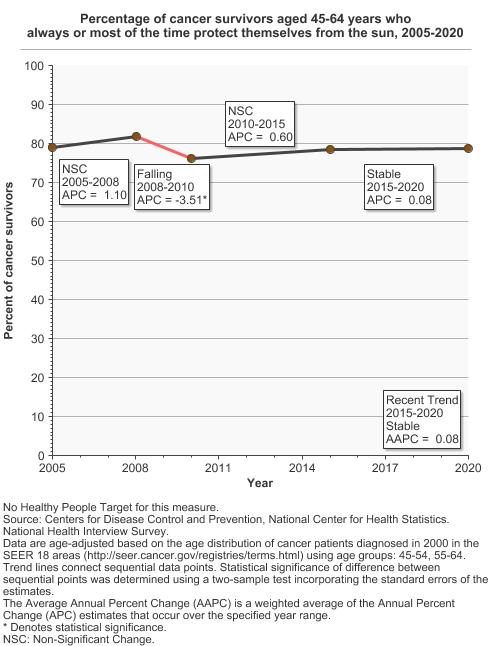
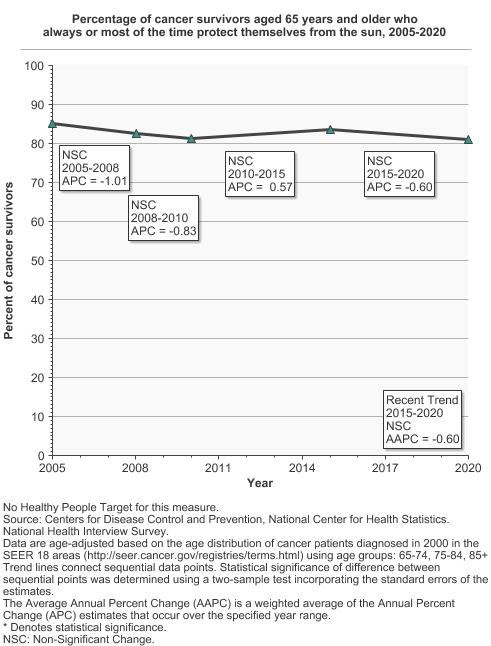
Ages 18-44 69.4 61.0 - 76.7 Ages 45-64 78.7 75.0 - 81.9 Ages 65 and older 81.1 79.0 - 83.1 - By Time Since Cancer Diagnosis
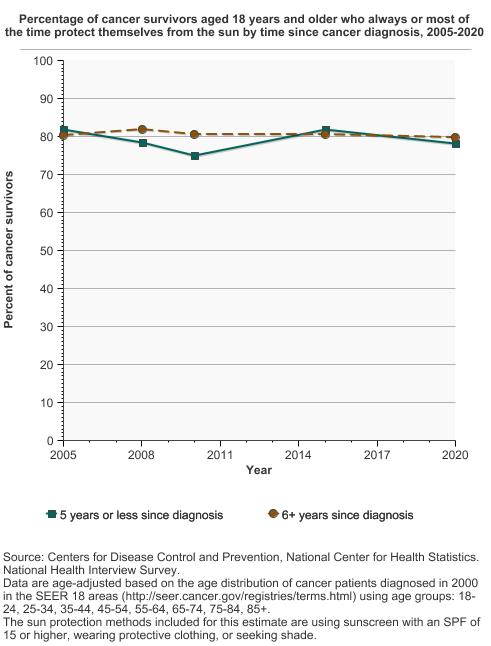
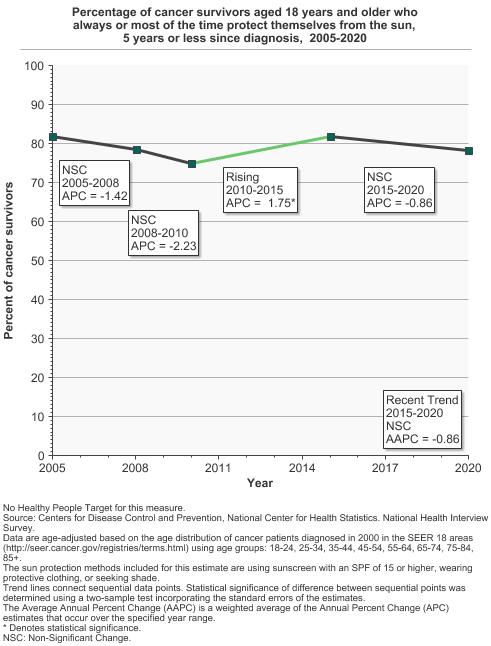
Percentage of cancer survivors aged 18 years and older who always or most of the time protect themselves from the sun by time since cancer diagnosis, 2005-2020 Overview Graph Detailed Trend Graphs Most Recent Estimates (2020) Percent of cancer survivors 95% Confidence Interval 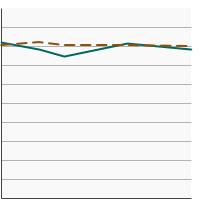
5 years or less since diagnosis 78.3 74.9 - 81.3 6+ years since diagnosis 79.8 77.4 - 82.0
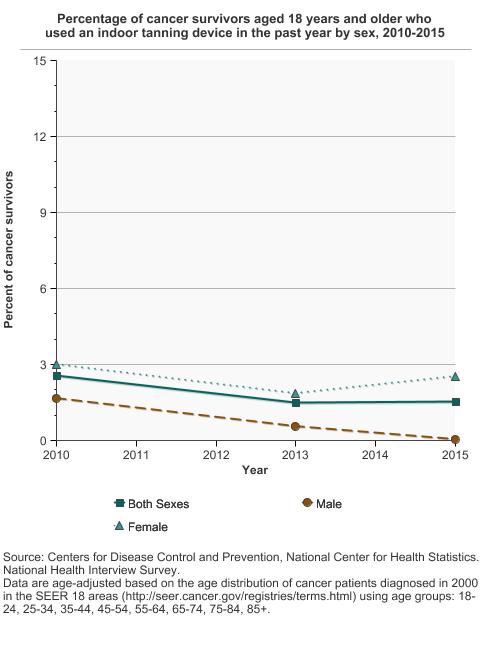
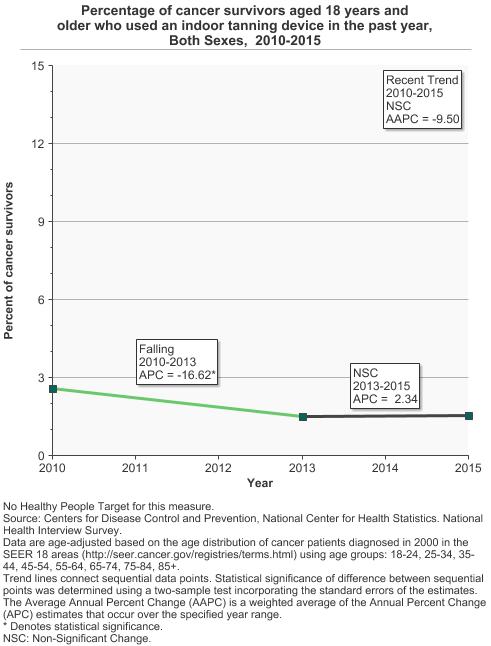
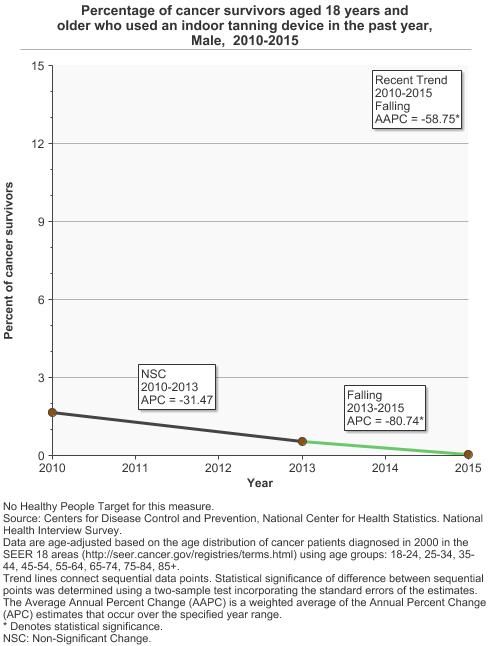
- Indoor Tanning
- By Sex
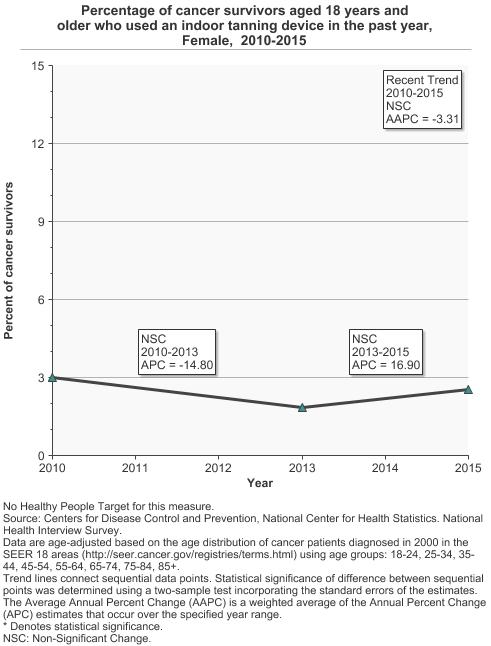
Percentage of cancer survivors aged 18 years and older who used an indoor tanning device in the past year by sex, 2010-2015 Overview Graph Detailed Trend Graphs Most Recent Estimates (2015) Percent of cancer survivors 95% Confidence Interval 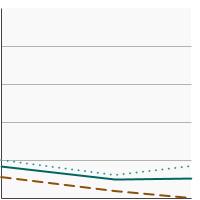
Both Sexes 1.6 0.9 - 2.6 Male 0.0 0.0 - 0.1 Female 2.5 1.5 - 4.2 - By Age
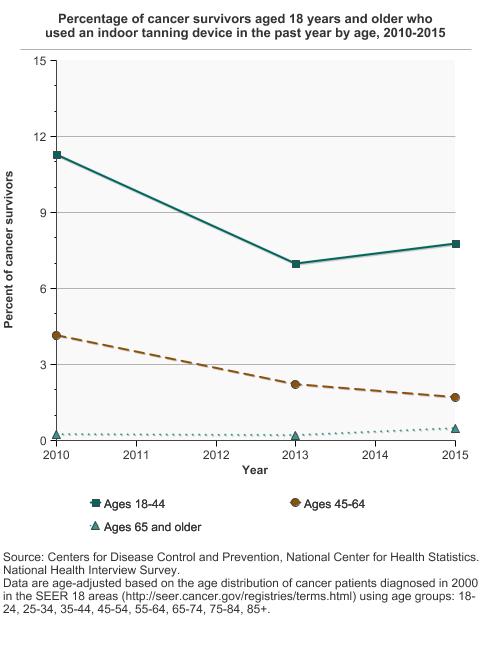
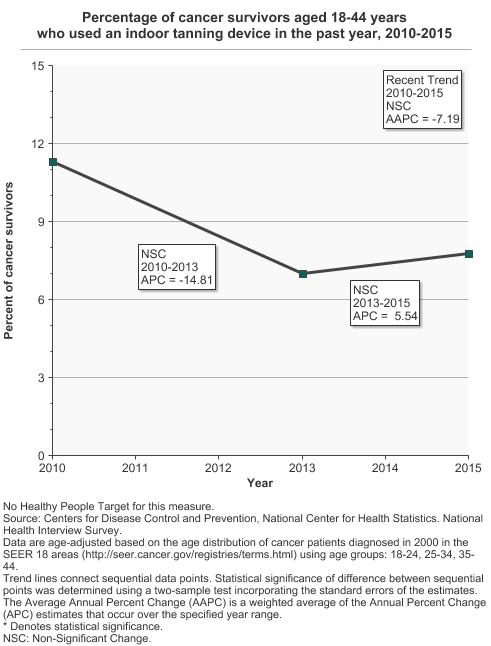
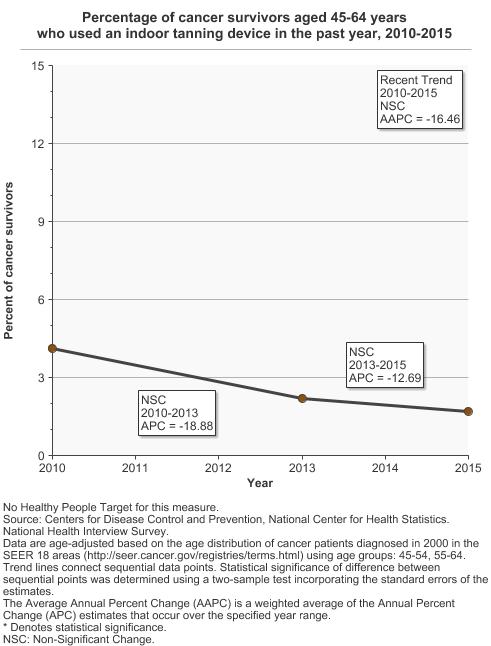
Percentage of cancer survivors aged 18 years and older who used an indoor tanning device in the past year by age, 2010-2015 Overview Graph Detailed Trend Graphs Most Recent Estimates (2015) Percent of cancer survivors 95% Confidence Interval 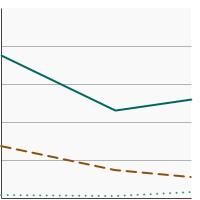
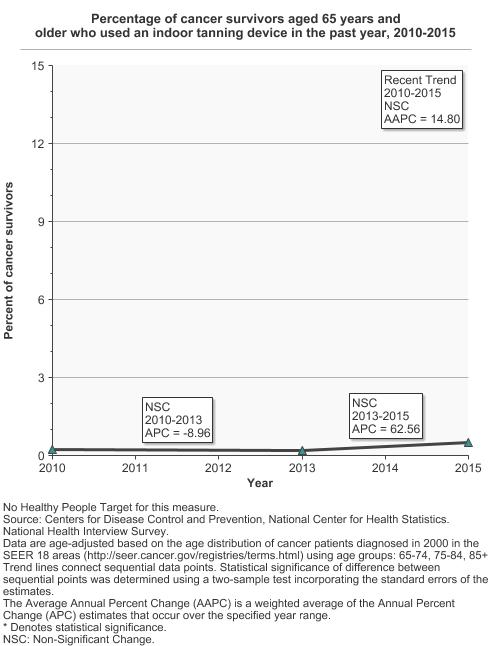
Ages 18-44 7.8 4.5 - 13.2 Ages 45-64 1.7 0.7 - 3.9 Ages 65 and older 0.5 0.1 - 2.6 - By Time Since Cancer Diagnosis
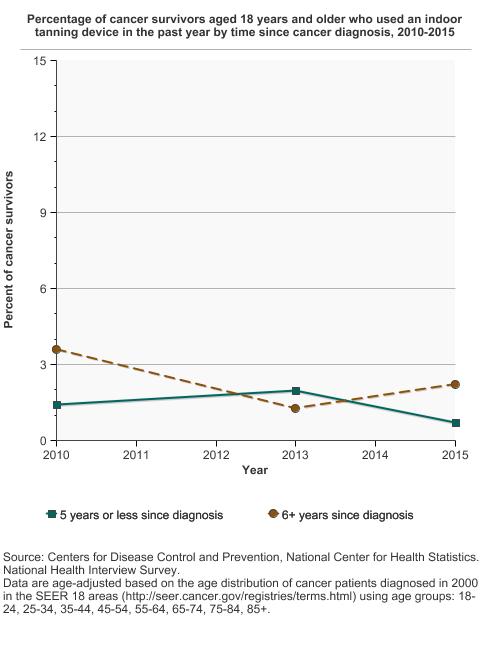
Percentage of cancer survivors aged 18 years and older who used an indoor tanning device in the past year by time since cancer diagnosis, 2010-2015 Overview Graph Detailed Trend Graphs Most Recent Estimates (2015) Percent of cancer survivors 95% Confidence Interval 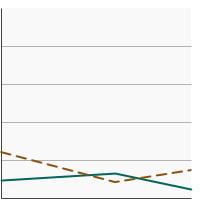
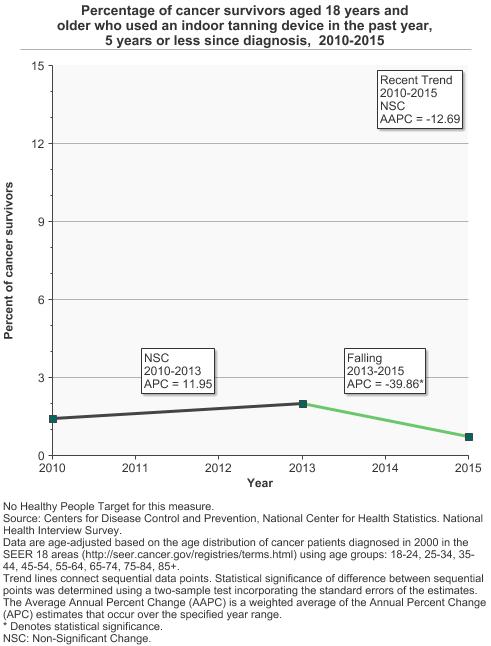
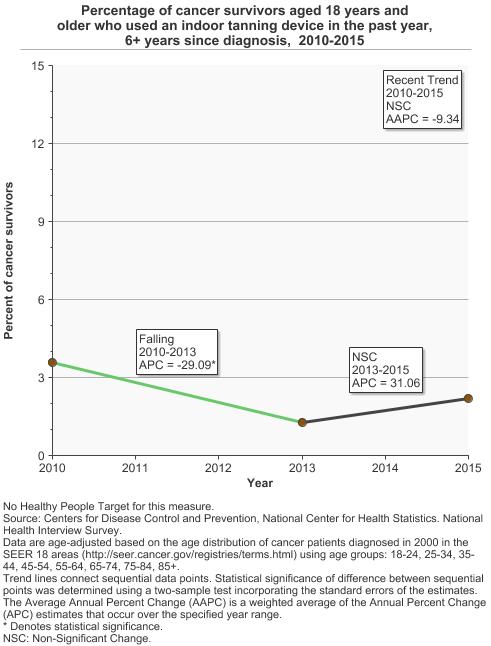
5 years or less since diagnosis 0.7 0.3 - 2.0 6+ years since diagnosis 2.2 1.3 - 3.8
- Sunburn
- By Sex
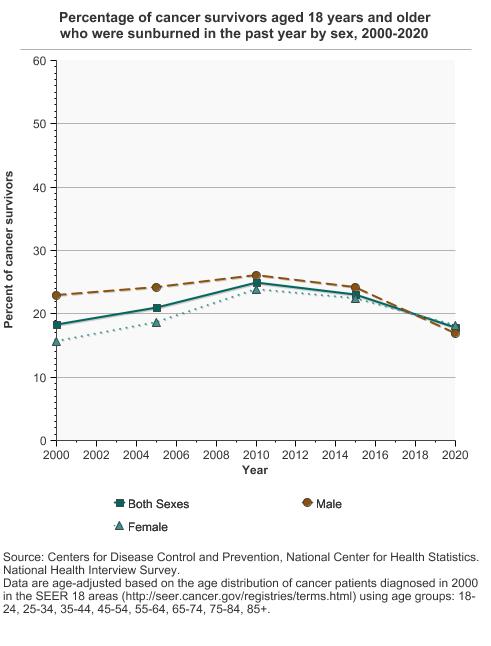
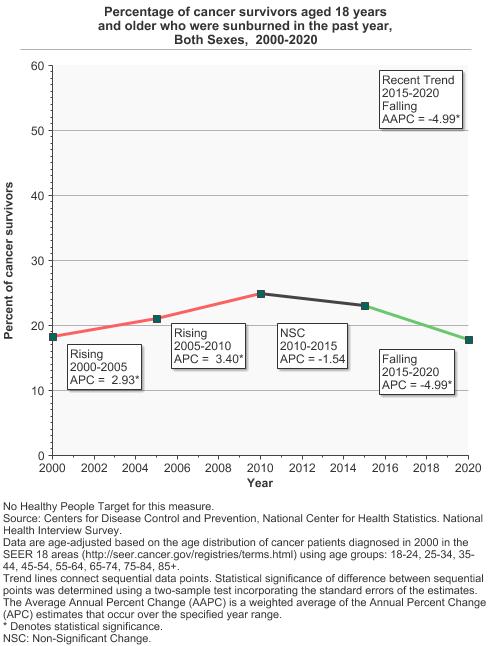
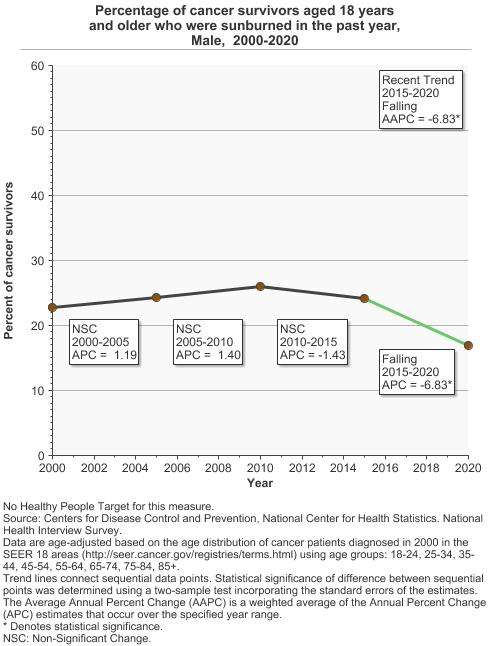
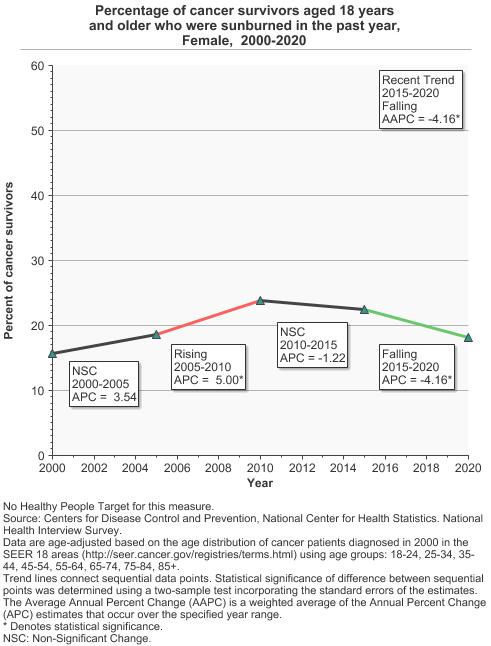
Percentage of cancer survivors aged 18 years and older who were sunburned in the past year by sex, 2000-2020 Overview Graph Detailed Trend Graphs Most Recent Estimates (2020) Percent of cancer survivors 95% Confidence Interval 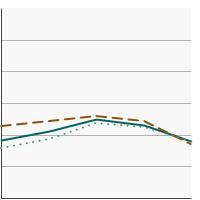
Both Sexes 17.8 16.2 - 19.6 Male 17.0 14.5 - 19.8 Female 18.1 16.0 - 20.5 - By Age
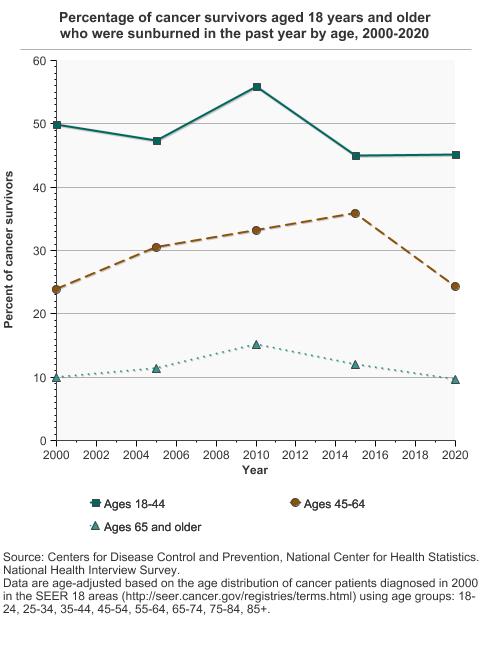
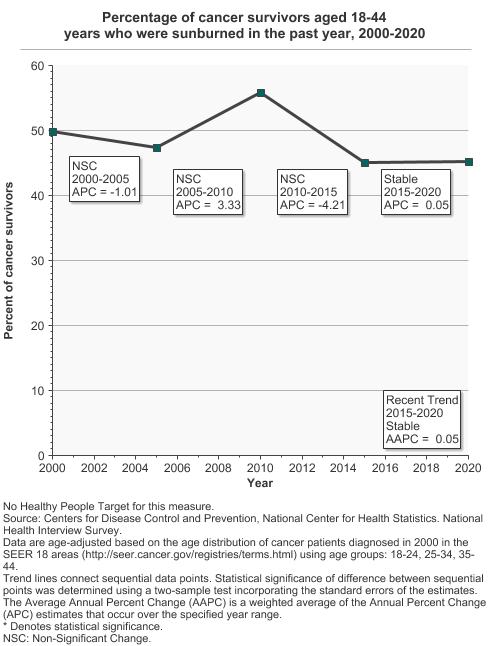
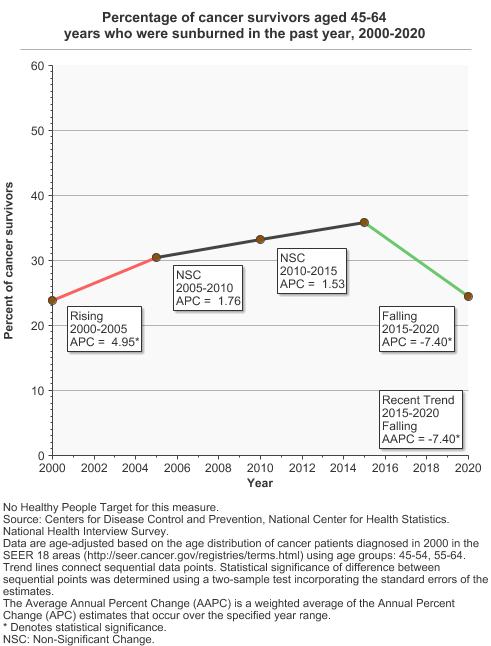
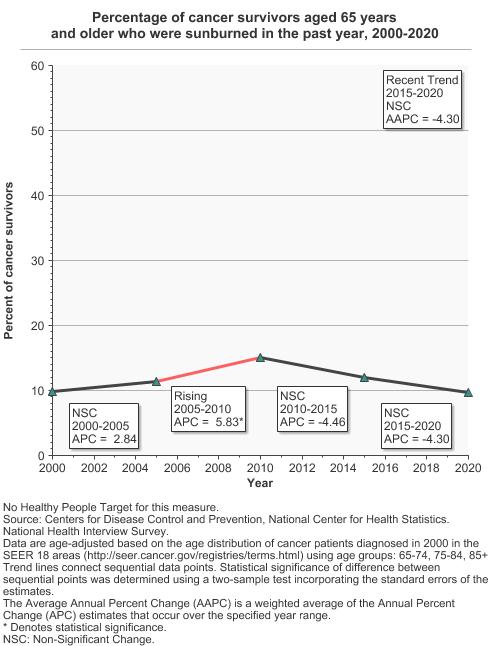
Percentage of cancer survivors aged 18 years and older who were sunburned in the past year by age, 2000-2020 Overview Graph Detailed Trend Graphs Most Recent Estimates (2020) Percent of cancer survivors 95% Confidence Interval 
Ages 18-44 45.2 37.3 - 53.3 Ages 45-64 24.4 20.9 - 28.2 Ages 65 and older 9.6 8.2 - 11.3 - By Time Since Cancer Diagnosis
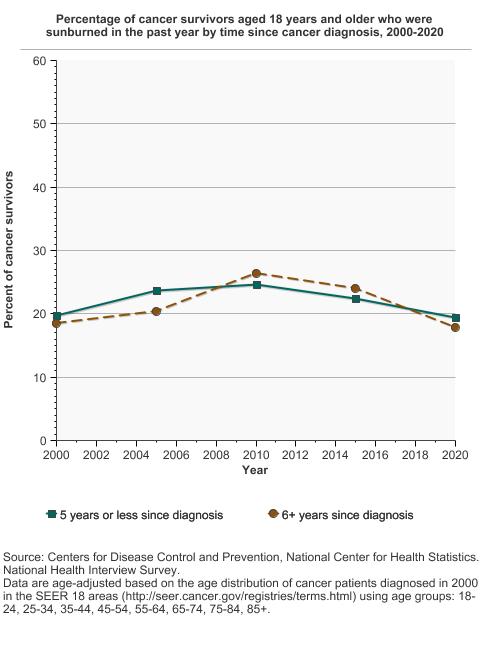
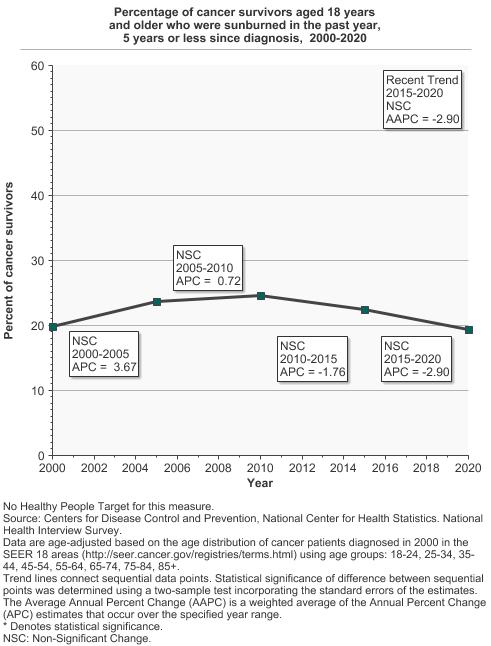
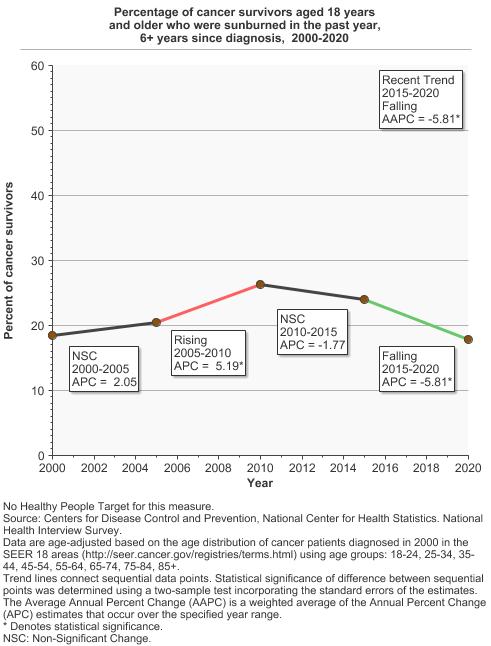
Percentage of cancer survivors aged 18 years and older who were sunburned in the past year by time since cancer diagnosis, 2000-2020 Overview Graph Detailed Trend Graphs Most Recent Estimates (2020) Percent of cancer survivors 95% Confidence Interval 
5 years or less since diagnosis 19.4 16.4 - 22.8 6+ years since diagnosis 17.8 16.0 - 19.9
Additional Information
- Skin Cancer. National Cancer Institute.
- Skin Cancer. American Cancer Society.
- Skin Cancer. Centers for Disease Control and Prevention.
- Skin Cancer. National Council on Skin Cancer Prevention.
- FDA Proposes Sunscreen Regulation Changes. U.S. Food and Drug Administration.
- Sun protection factor (SPF). U.S. Food and Drug Administration.
- Sunscreen: How to Help Protect Your Skin from the Sun. U.S. Food and Drug Administration.
- Sun Safety. U.S. Environmental Protection Agency.
- Melanoma Treatment (PDQ®) - Health Professional Version. National Cancer Institute.
- Skin Cancer Treatment (PDQ®) - Health Professional Version. National Cancer Institute.
- Sun Safety Evidence-Based Programs Listing. National Cancer Institute.
- Vitamin D and Calcium: A Systematic Review of Health Outcomes (Update). AHRQ Publication No. 14-E004-EF September 2014. Evidence Report/Technology Assessment Number 217.
- Surgeon General's Call to Action to Prevent Skin Cancer. Centers for Disease Control and Prevention.
- Skin cancer: multicomponent community-wide interventions. Community Preventive Services Task Force.
- Stratosphere: UV index. National Weather Service: Climate Prediction Center.
- Code of Federal Regulations Title 21, Volume 76, Number 117, Part 352: Sunscreen Drug Products for Over-the-Counter Human Use (April 2019). U.S. Food and Drug Administration.
- Code of Federal Regulations Title 21, Volume 76, Number 117, Part 201: Labeling (July 2018). U.S. Food and Drug Administration.
- FDA proposed rule: sunscreen drug products for over-the-counter-human use; proposal to amend and lift stay on monograph. U.S. Food and Drug Administration.
- Skin Cancer Prevention: Behavioral counseling. U.S. Preventive Services Task Force.
- Association of occupational sun safety policy and actions in state transportation sector in the United States. Buller DB, Walkosz BJ, Olivas S, et al. Am J Ind Med. 2021 Apr;64(4):274-282.
- Interdisciplinary perspectives on sun safety. Geller AC, Jablonski NG, Pagoto SL, et al. JAMA Dermatol. 2018;154(1):88-92.
- Reduced melanoma after regular sunscreen use: randomized trial follow-up. Green A, Williams GM, Logan V, and Strutton GM. J Clin Oncol. 2011;29(3):257–263.
- Estimated cost of sunburn-associated visits to US hospital emergency departments. Guy GP, Berkowitz Z, and Watson M. JAMA Dermatol. 2017;153(1):90-92.
- Trends in indoor tanning and its association with sunburn among US adults. Guy GP, Watson M, Seidenberg AB et al. J Am Acad Dermatol. 2017;76(6):1191-1193.
- The potential impact of reducing indoor tanning on melanoma prevention and treatment costs in the United States: an economic analysis. Guy GP, Zhang Y, Ekwueme DU, et al. J Am Acad Dermatol. 2017;76(2):226-233.
- Prevalence of sun protection use and sunburn and association of demographic and behavioral characteristics with sunburn among US adults. Holman DM, Ding H, Guy GP et al. JAMA Dermatol. 2018; 154(5):561-568.
- Health Beliefs About UV and Skin Cancer Risk Behaviors. Cancer Control. Julian A, Thorburn S, Geldhof GJ. 2020 Jan-Dec;27(4):1073274819894008.
- Benefit–Cost Analysis of the Danish Sun Safety Campaign 2007–2015: Cost Savings from Sunburn and Sunbed Use Reduction and Derived Skin Cancer Reductions 2007–2040 in the Danish Population. Køster B, Meyer MKH, Søgaard J, Dalum P. Pharmacoecon Open. 2020 Sep;4(3):419-425.
- Prevalence and predictors of total-body skin examination among US adults: 2005 National Health Interview Survey. Lakhani NA, Shaw KM, Thompson T, et al. J Am Acad Dermatol. 2011: 65(3): 645-648.
- Prevalence and correlates of skin self-examination practices among cutaneous malignant melanoma survivors. Manne SL, Heckman CJ, Kashy D, et al. Prev Med Rep. 2020 May 1;19:101110.
- Effect of Sunscreen Application Under Maximal Use Conditions on Plasma Concentration of Sunscreen Active Ingredients: A Randomized Clinical Trial. Matta MK, Zusterzeel R, Pilli NR, et al. JAMA. 2019;321(21):2082-2091.
- Decision tree model v traditional measures to identify patterns of sun-protective behaviors and sun sensitivity associated with sunburn. Morris KL and Perna FM. JAMA Dermatol. 2018;154(8):897-902.
- Environmental effects of stratospheric ozone depletion, UV radiation, and interactions with climate change: UNEP Environmental Effects Assessment Panel, Update 2020. Neale RE, Barnes PW, Robson TM, et al. Photochem Photobiol Sci. 2021 Jan;20(1):1-67.
- The effect of sunscreen on vitamin D: a review. Neale RE, Khan SR, Lucas RM, et al. Br J Dermatol. 2019 Nov;181(5):907-915.
- Remote skin self-examination training of melanoma survivors and their skin check partners: A randomized trial and comparison with in-person training. Robinson JK, Reavy R, Mallett KA, Turrisi R. Cancer Med. 2020 Oct;9(19):7301-7309.
- Melanoma Skin Self-Examination Education During Mammography: Health Burden of Women Impairs Implementation. Robinson JK, Brown Z, Spring B. J Cancer Educ. 2020 Feb 24:10.1007/s13187-020-01714-4.
- Community-wide interventions to prevent skin cancer: two community guide systematic reviews. Sandhu PK, Elder R, Patel M, et al. Am J Prev Med. 2016;51(4):531-9.
- Implementation of the SunSmart program and population sun protection behaviour in Melbourne, Australia: Results from cross-sectional summer surveys from 1987 to 2017. Tabbakh T, Volkov A, Wakefield M, Dobbinson S. PLoS Med. 2019;16(10):e1002932.
- Walking and Sun Protective Behaviors: Cross-Sectional Associations of Beneficial Health Factors. Tribby CP, Perna FM, Berrigan D. Int J Environ Res Public Health. 2019 Jul 3;16(13):2361.
- SEER Cancer Statistics Review, National Cancer Institute.
- National Health Interview Survey. Centers for Disease Control and Prevention, National Center for Health Statistics.