On This Page:
- Background
- Measure
- Healthy People 2030 Target
- Data Source
- Trends and Most Recent Estimates
- Additional Information
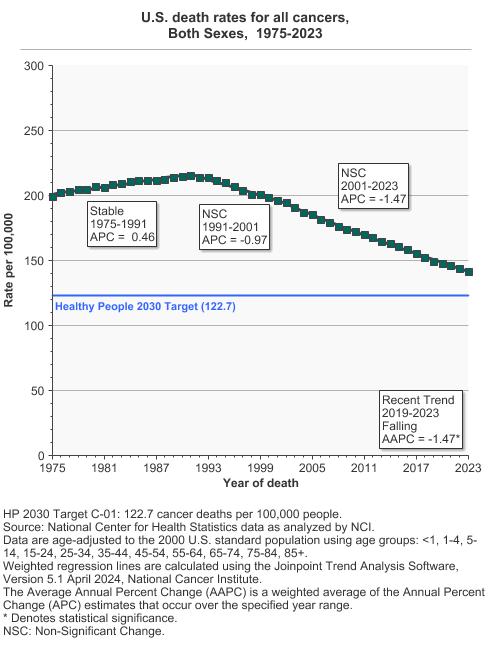
In 2023, the death rate for all cancers combined was 141.8 per 100,000 people per year.
Background
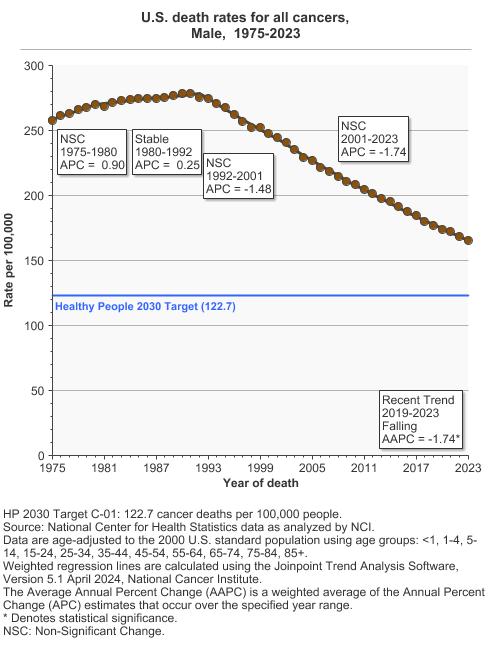
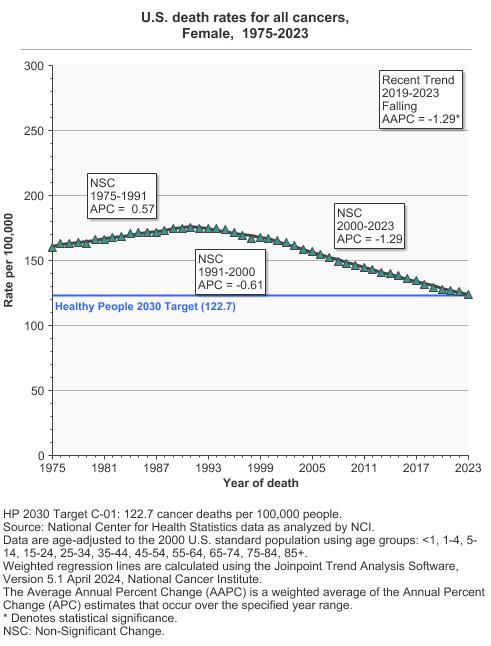
The rate of death from cancer in the United States continues to decline among both men and women, among all major racial and ethnic groups, and for the most common types of cancer, including lung, colorectal, breast, and prostate cancers. The Annual Report to the Nation on the Status of Cancer shows that the death rate from all cancers combined is continuing the decline that began in the early 1990s.
Still, in 2023 cancers of the female breast, prostate, lung, colorectal, and pancreas accounted for over one-half (51 percent) of all cancer deaths in the United States. Lung cancer alone claimed 21 percent of lives lost to cancer.
Measure
The number of cancer deaths per 100,000 people per year, age-adjusted to a U.S. 2000 standard population.
Data Source
Centers for Disease Control and Prevention, National Center for Health Statistics, 1975–2023.
Healthy People 2030 Target
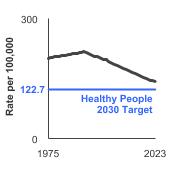
- Reduce the overall cancer death rate to 122.7 cancer deaths per 100,000 people per year.
Top 4 Cancer Sites
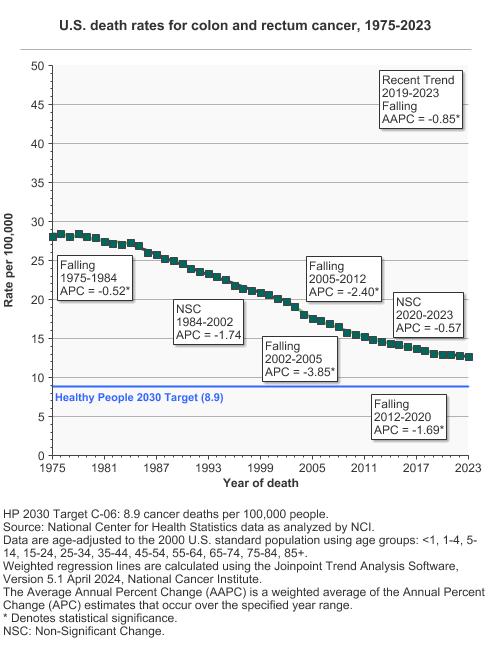
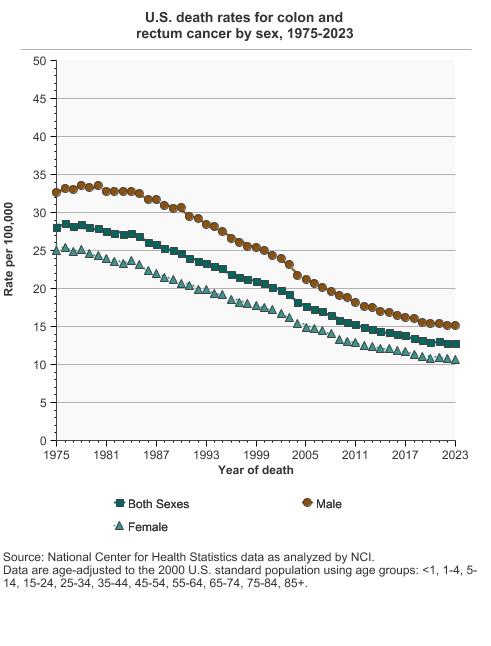
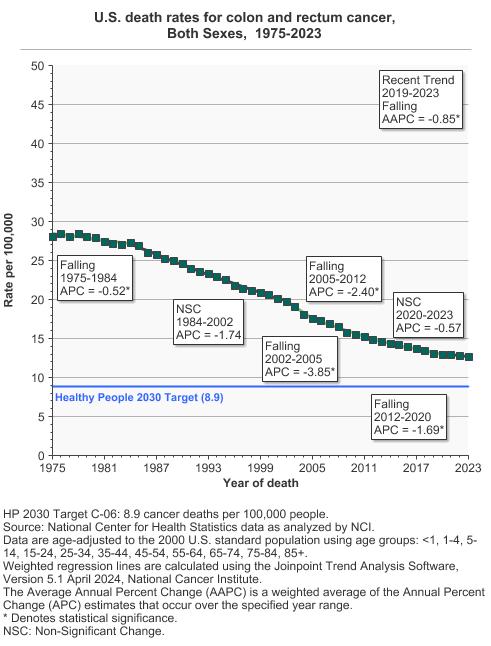
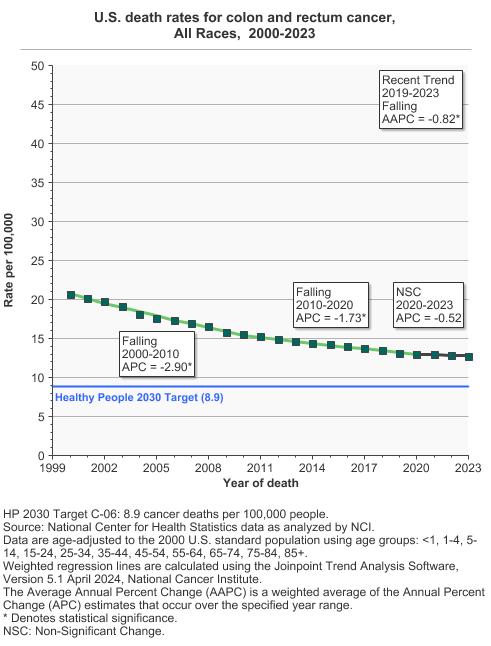
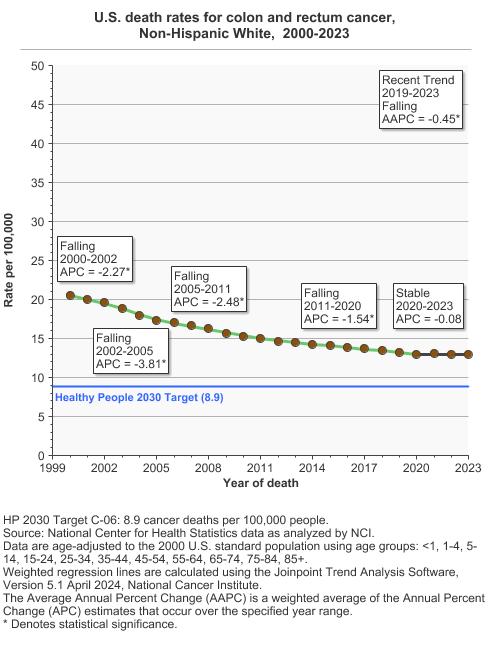
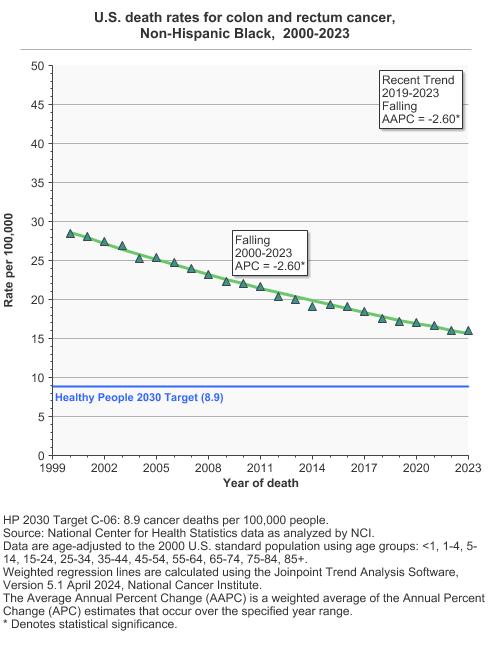
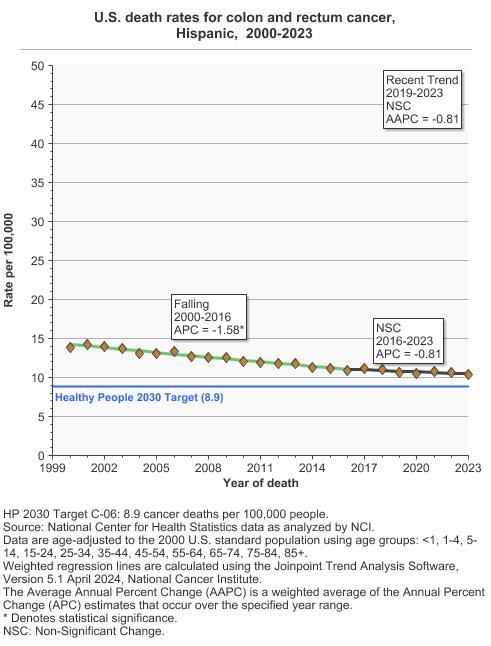
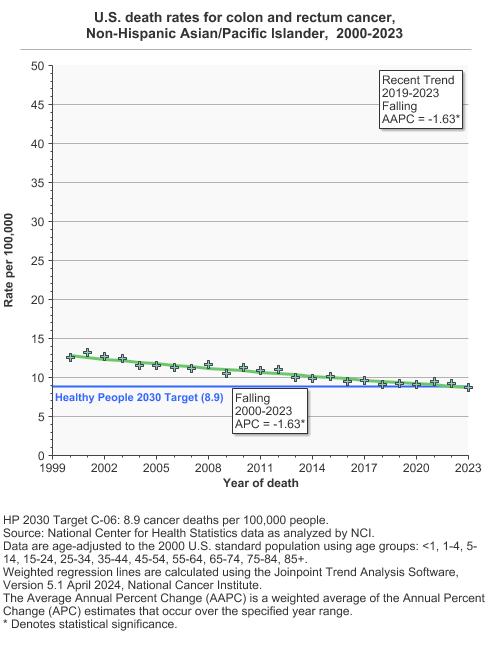
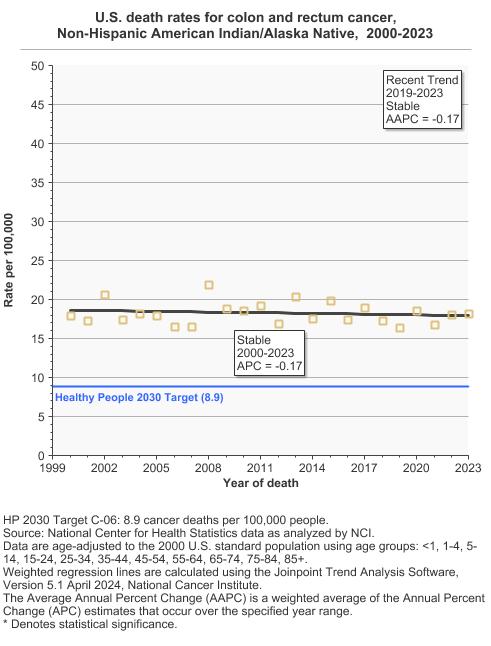
- Reduce the colorectal cancer death rate to 8.9 deaths per 100,000 people per year.
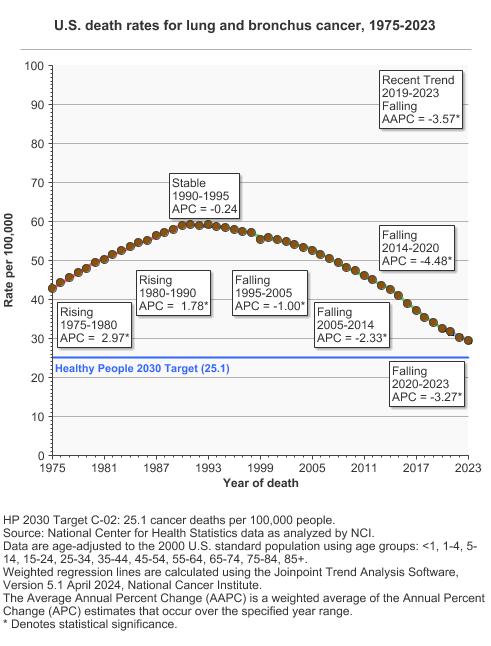
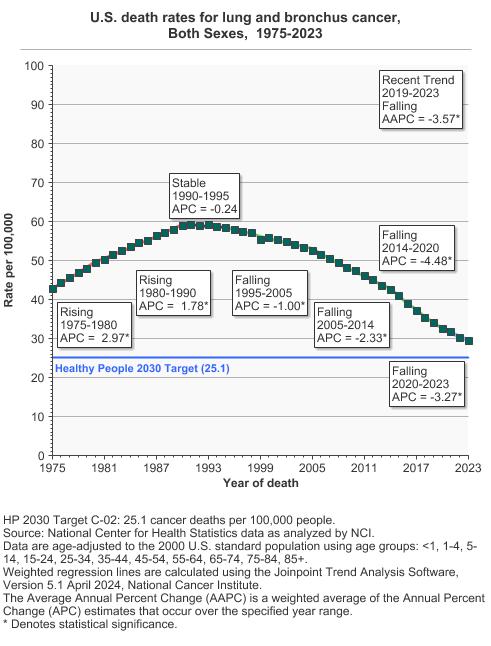
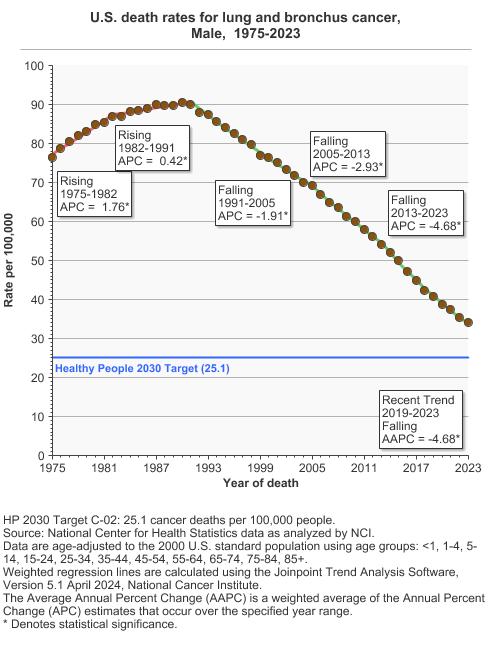
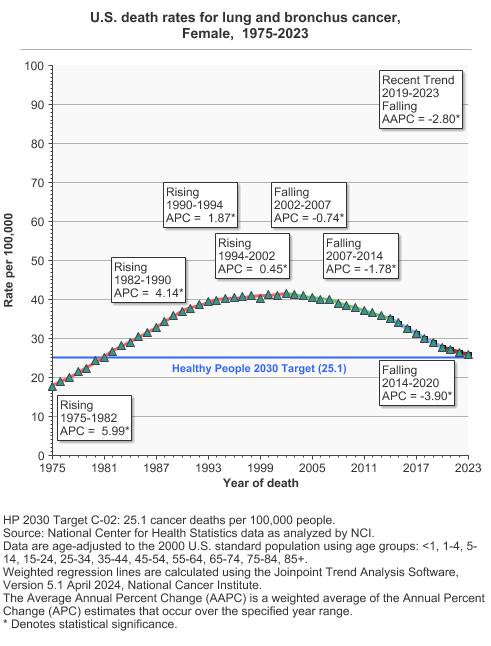
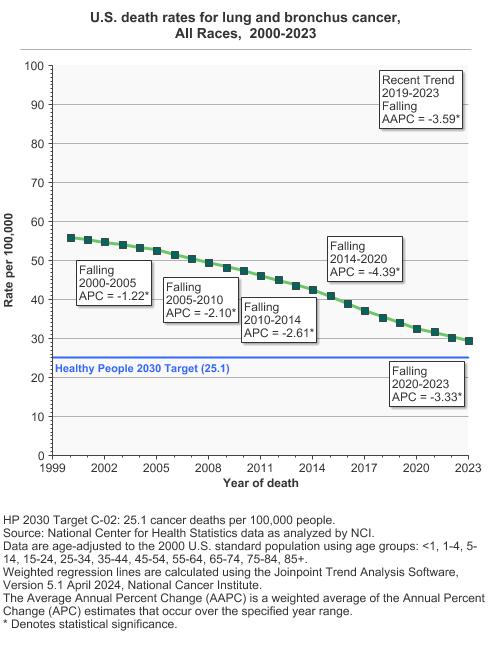
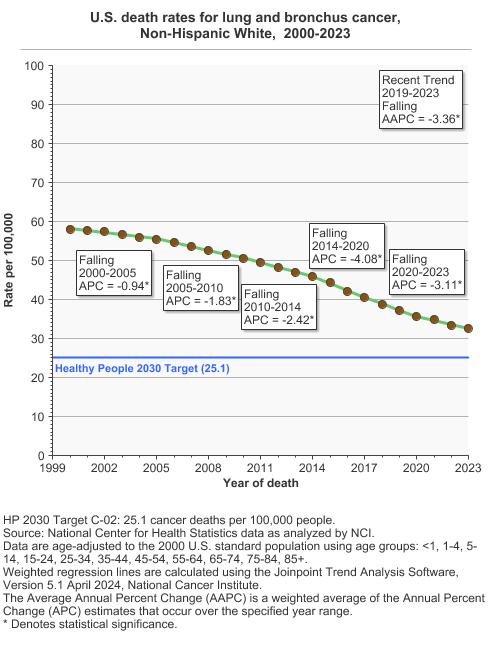
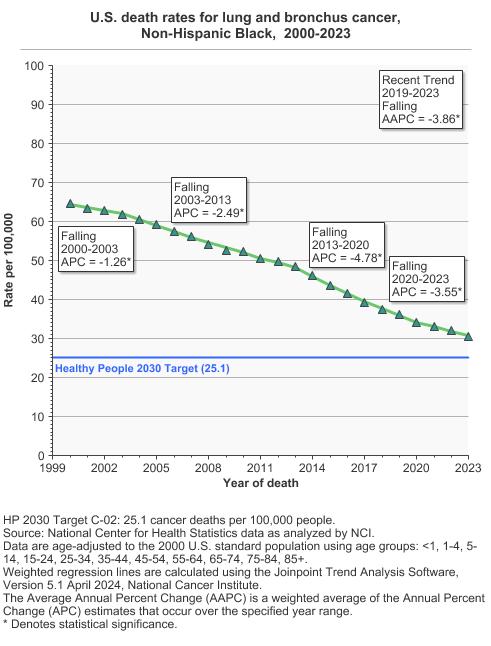
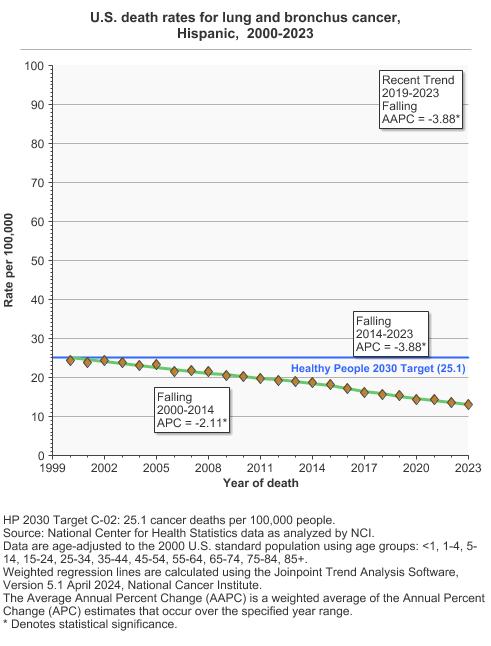
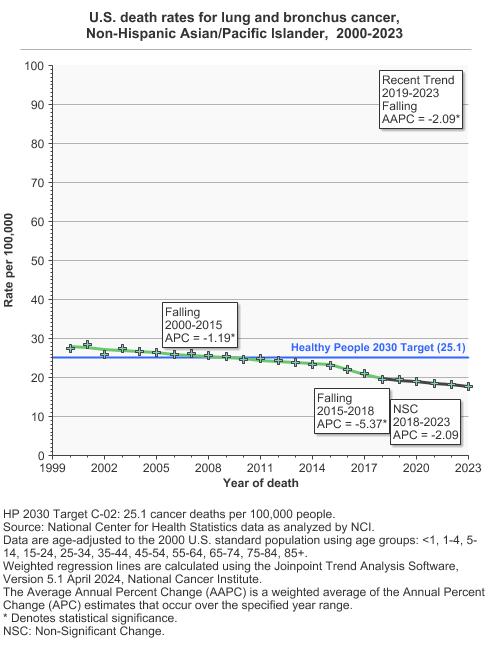
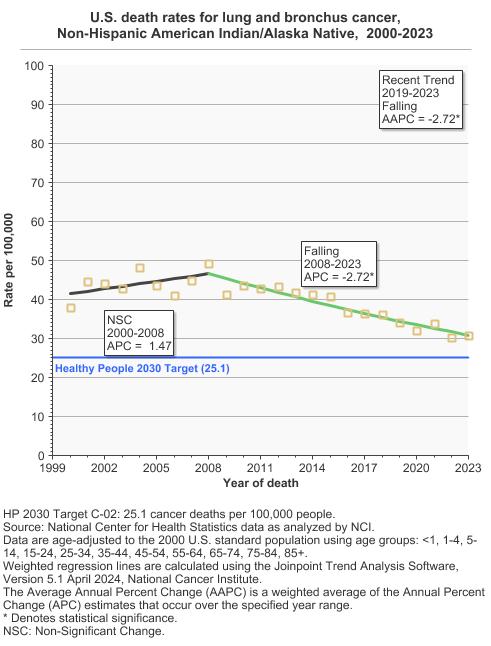
- Reduce the lung cancer death rate to 25.1 deaths per 100,000 people per year.
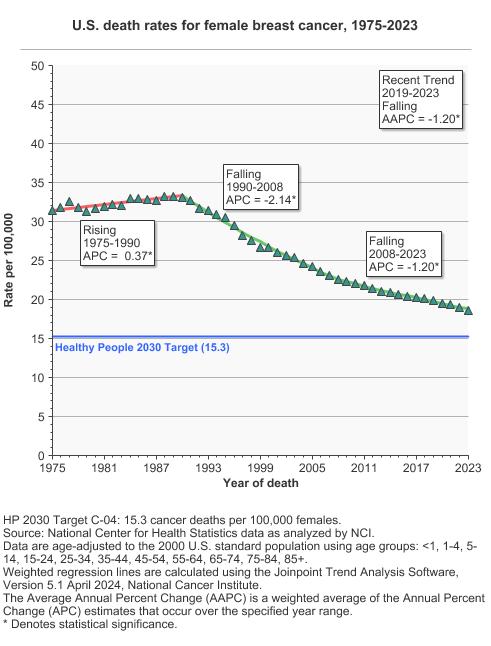
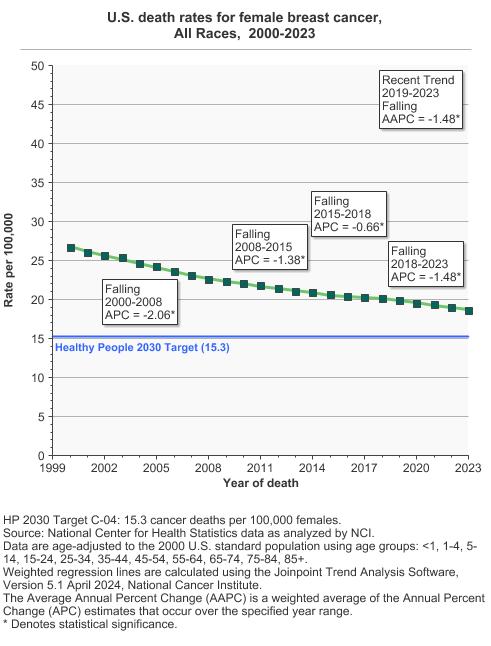
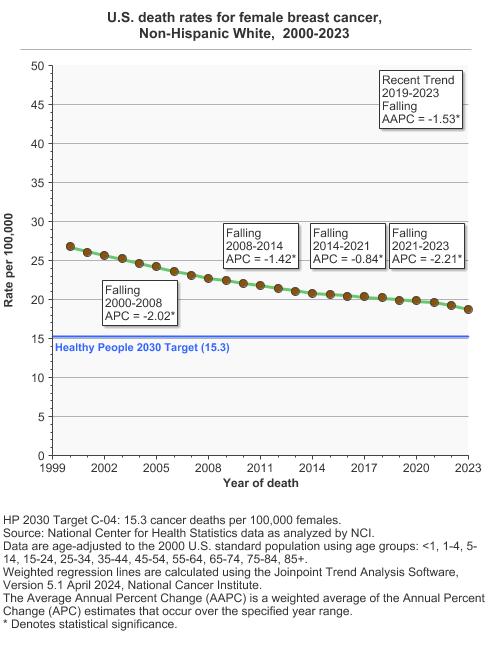
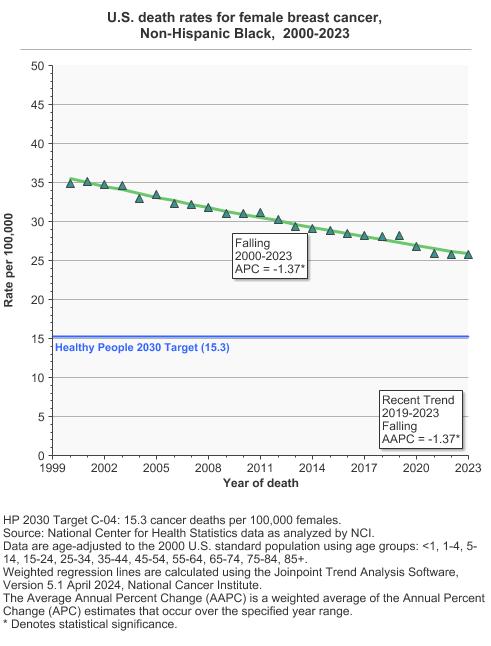
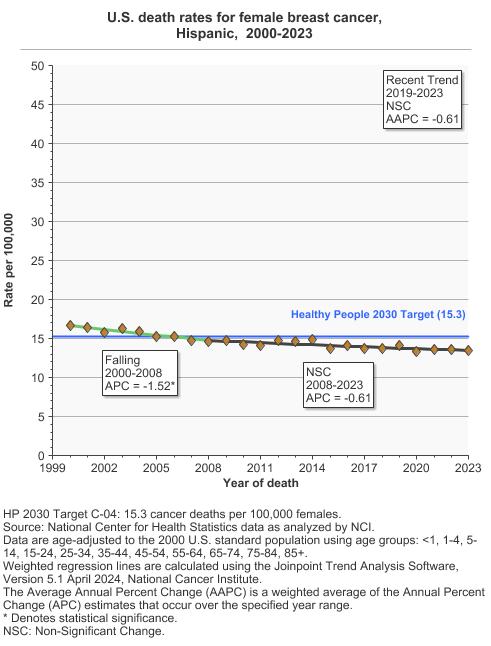
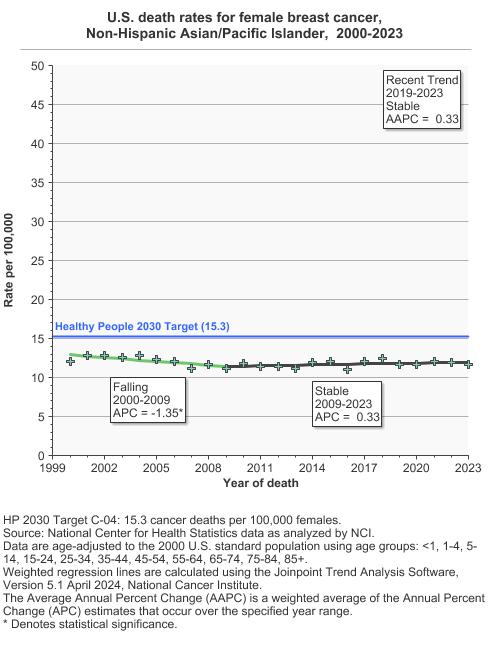
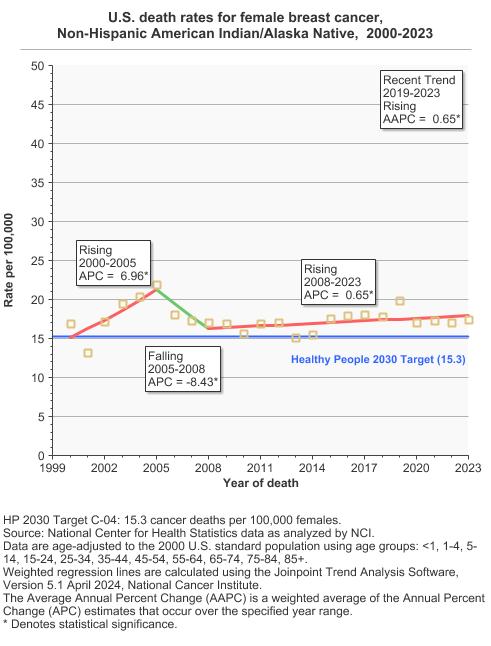
- Reduce the female breast cancer death rate to 15.3 deaths per 100,000 females per year.
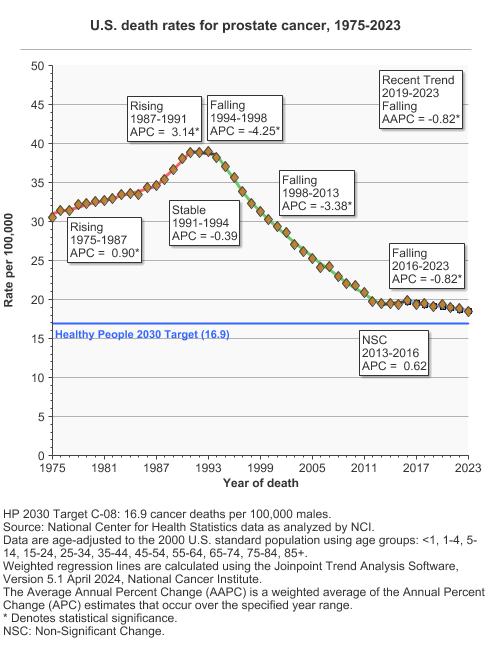
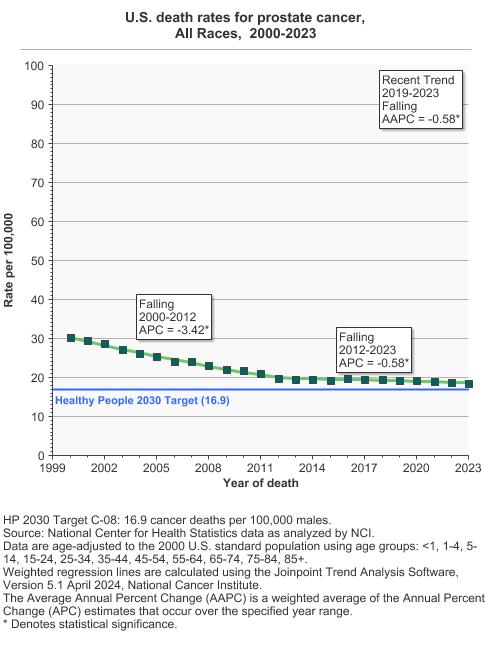
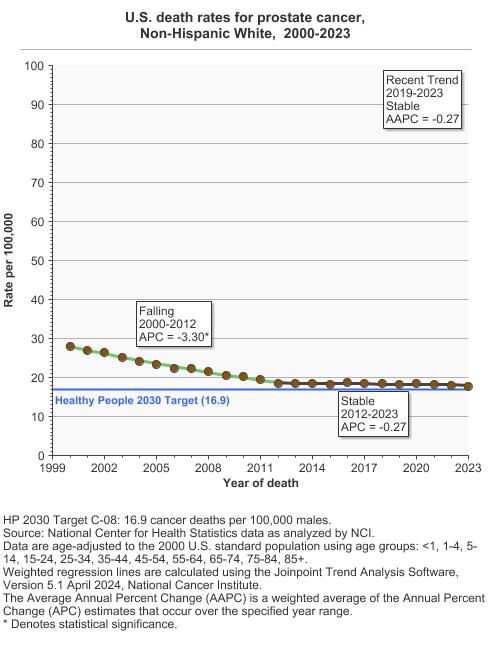
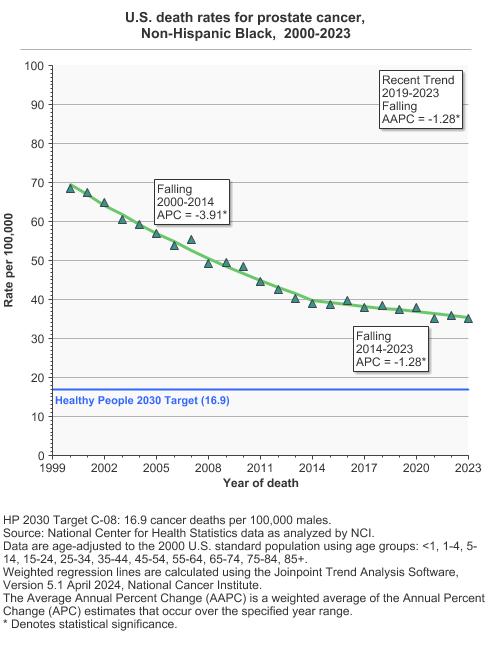
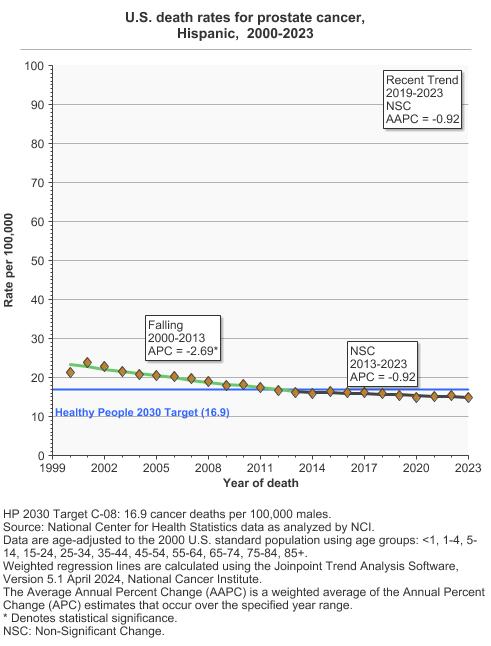
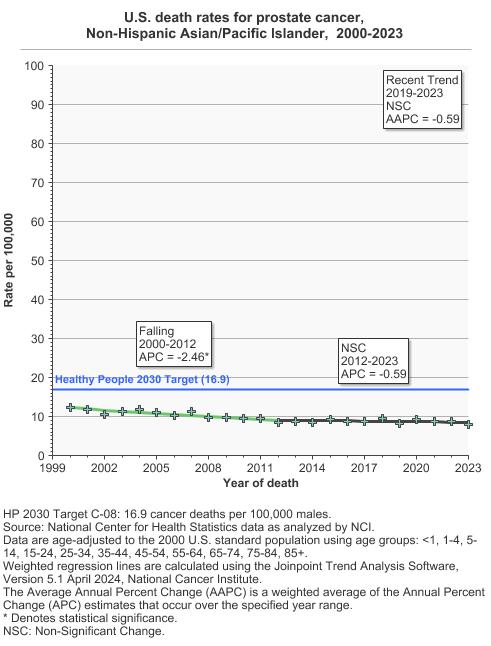
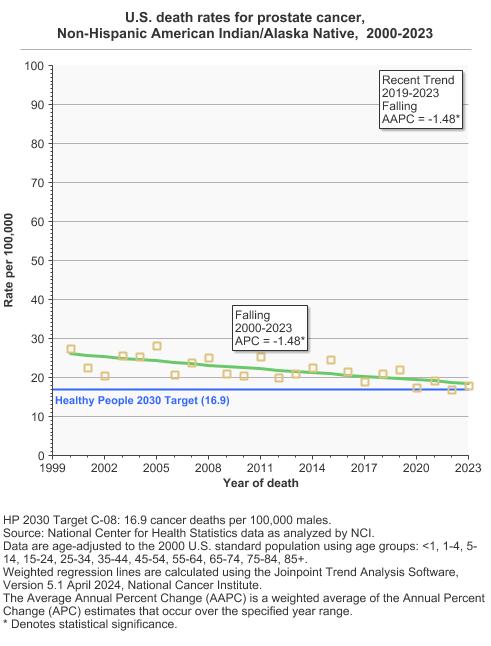
- Reduce the prostate cancer death rate to 16.9 deaths per 100,000 males per year.
Healthy People 2030 is a set of goals set forth by the Department of Health and Human Services.
Note: Goals are indicated as blue line on Detailed Trend Graphs.
Trends and Most Recent Estimates
- All Cancer Sites Combined
- By Sex
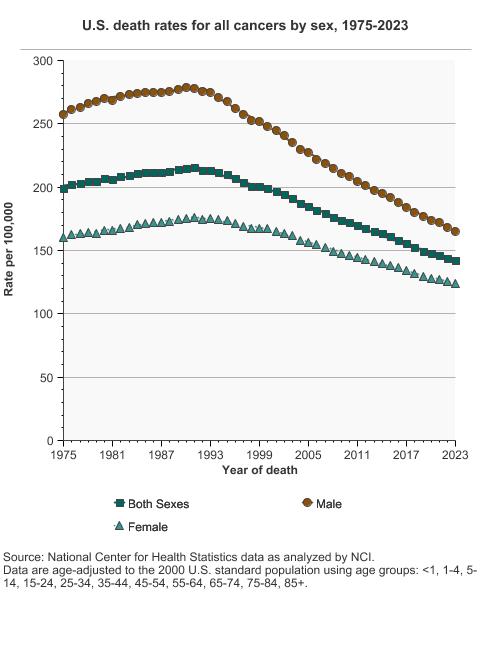
U.S. death rates for all cancers by sex, 1975-2023 Overview Graph Detailed Trend Graphs Most Recent Estimates (2023) Rate per 100,000 95% Confidence Interval 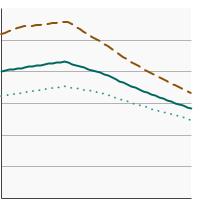

Both Sexes 
141.8 141.4 - 142.1 Male 165.3 164.7 - 165.9 Female 124.1 123.6 - 124.6 - By Race/Ethnicity
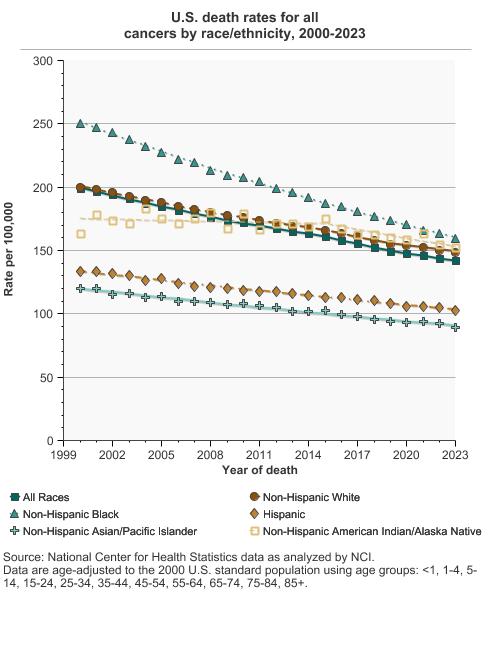
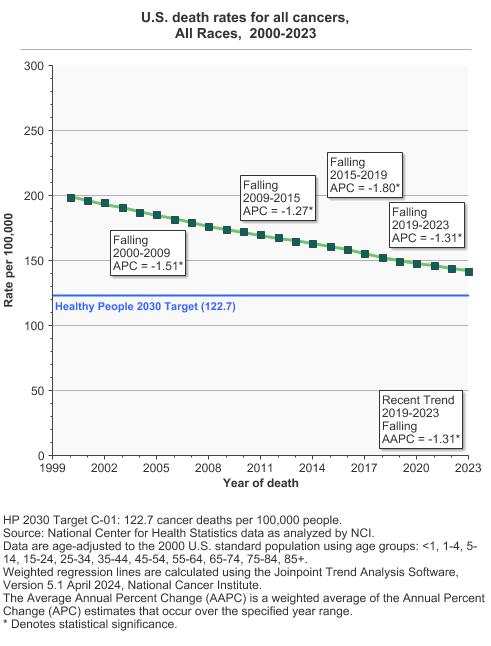
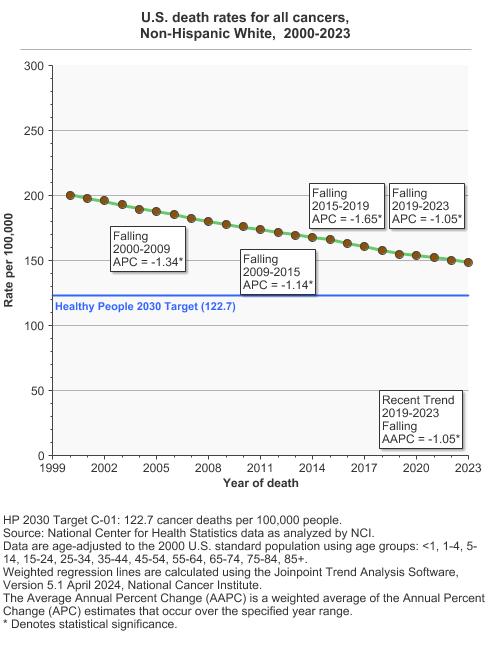
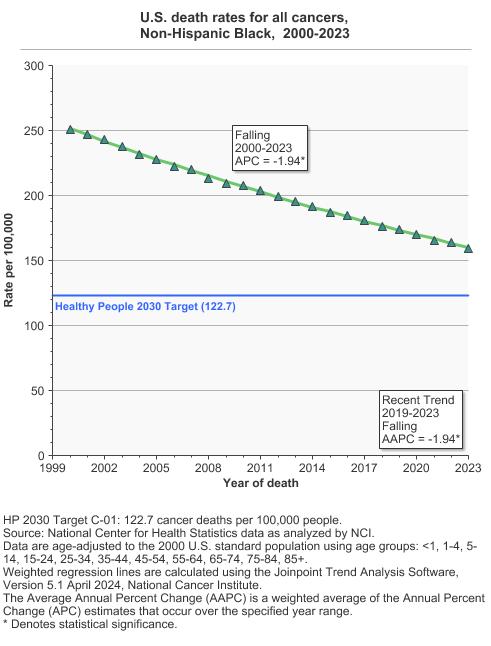
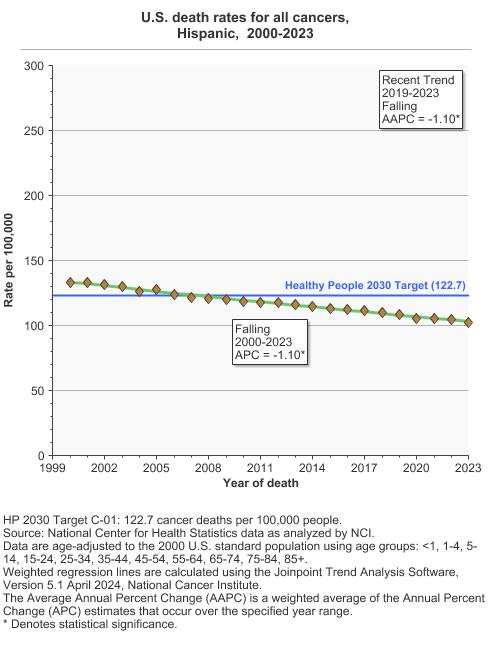
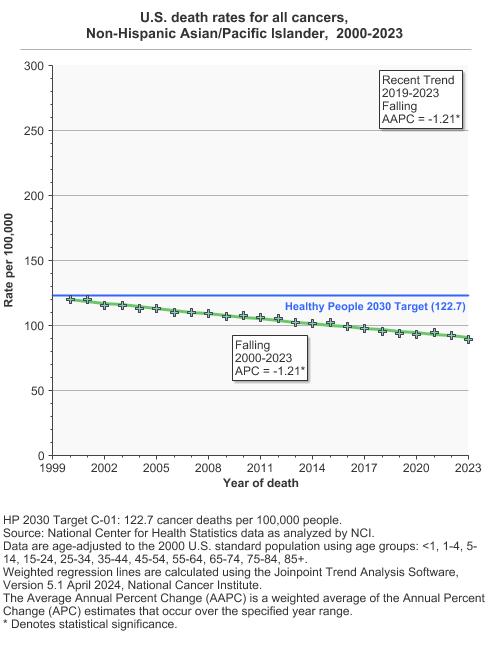
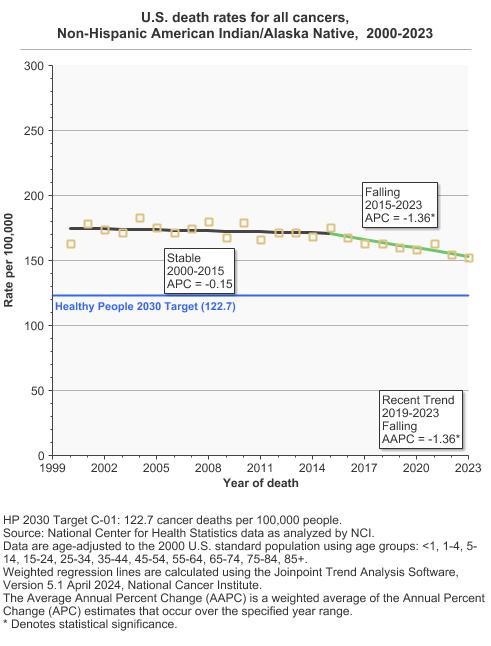
U.S. death rates for all cancers by race/ethnicity, 2000-2023 Overview Graph Detailed Trend Graphs Most Recent Estimates (2023) Rate per 100,000 95% Confidence Interval 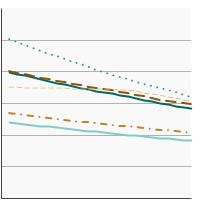
All Races 141.8 141.4 - 142.1 Non-Hispanic White 148.6 148.2 - 149.1 Non-Hispanic Black 159.3 158.1 - 160.5 Hispanic 102.6 101.6 - 103.5 Non-Hispanic Asian/Pacific Islander 89.5 88.3 - 90.7 Non-Hispanic American Indian/Alaska Native 152.4 146.6 - 158.4
- Top 4 Cancer Sites
- Comparison of Top Cancer Sites
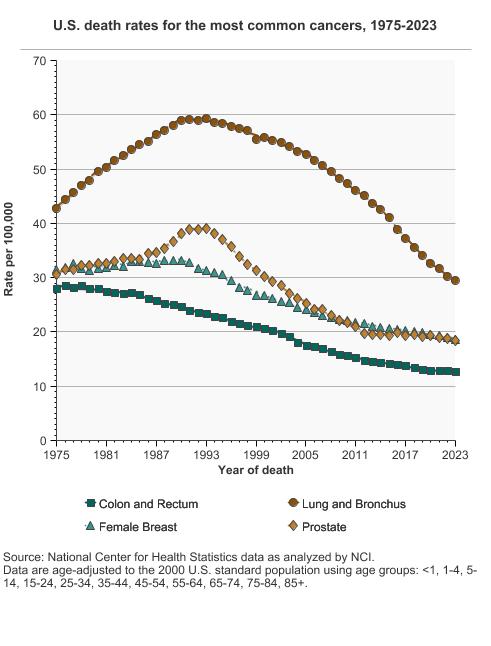
U.S. death rates for the most common cancers, 1975-2023 Overview Graph Detailed Trend Graphs Most Recent Estimates (2023) Rate per 100,000 95% Confidence Interval 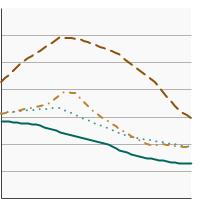
Colon and Rectum 12.7 12.6 - 12.9 Lung and Bronchus 29.5 29.3 - 29.6 Female Breast 18.6 18.5 - 18.8 Prostate 18.5 18.3 - 18.7 - Colon and Rectum Cancer by Sex
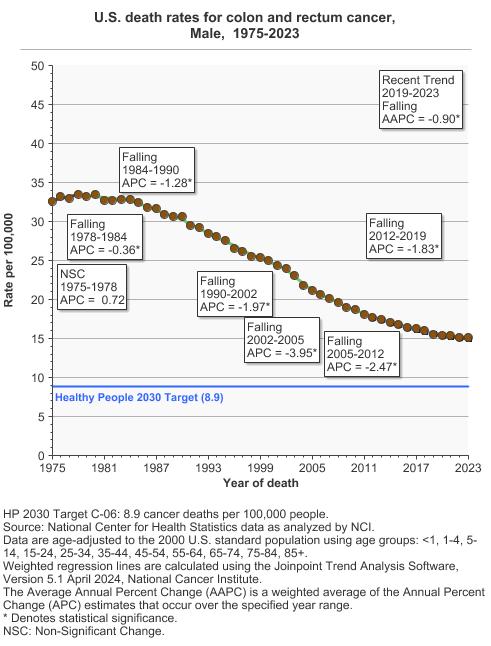
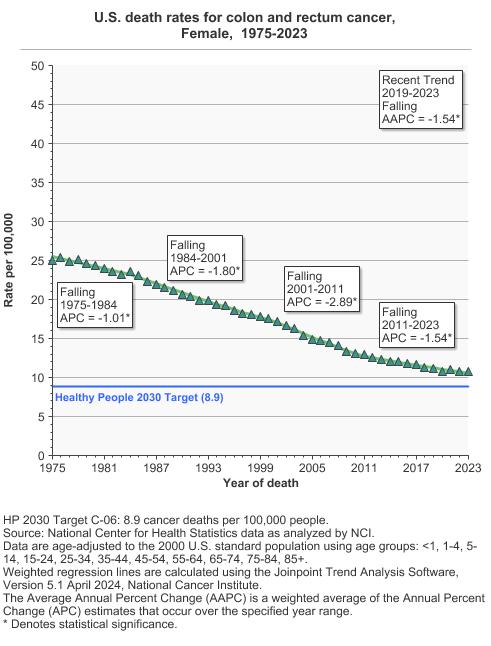
U.S. death rates for colon and rectum cancer by sex, 1975-2023 Overview Graph Detailed Trend Graphs Most Recent Estimates (2023) Rate per 100,000 95% Confidence Interval 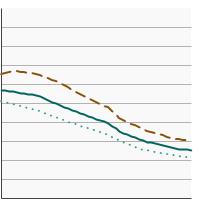
Both Sexes 12.7 12.6 - 12.9 Male 15.1 14.9 - 15.3 Female 10.7 10.6 - 10.8 - Colon and Rectum Cancer by Race/Ethnicity
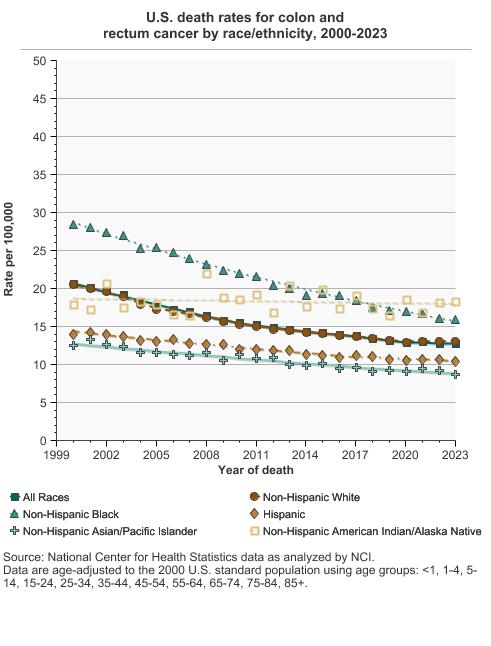
U.S. death rates for colon and rectum cancer by race/ethnicity, 2000-2023 Overview Graph Detailed Trend Graphs Most Recent Estimates (2023) Rate per 100,000 95% Confidence Interval 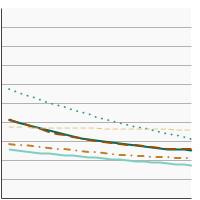
All Races 12.7 12.6 - 12.9 Non-Hispanic White 13.0 12.8 - 13.1 Non-Hispanic Black 16.0 15.6 - 16.4 Hispanic 10.4 10.1 - 10.7 Non-Hispanic Asian/Pacific Islander 8.7 8.4 - 9.1 Non-Hispanic American Indian/Alaska Native 18.3 16.3 - 20.4 - Lung and Bronchus Cancer by Sex
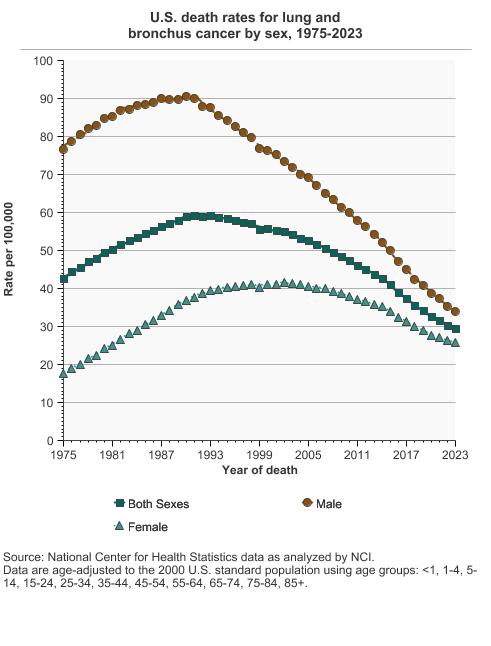
U.S. death rates for lung and bronchus cancer by sex, 1975-2023 Overview Graph Detailed Trend Graphs Most Recent Estimates (2023) Rate per 100,000 95% Confidence Interval 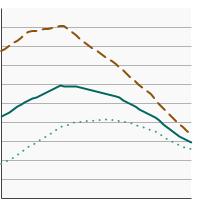
Both Sexes 29.5 29.3 - 29.6 Male 34.1 33.8 - 34.3 Female 25.8 25.6 - 26.0 - Lung and Bronchus Cancer by Race/Ethnicity
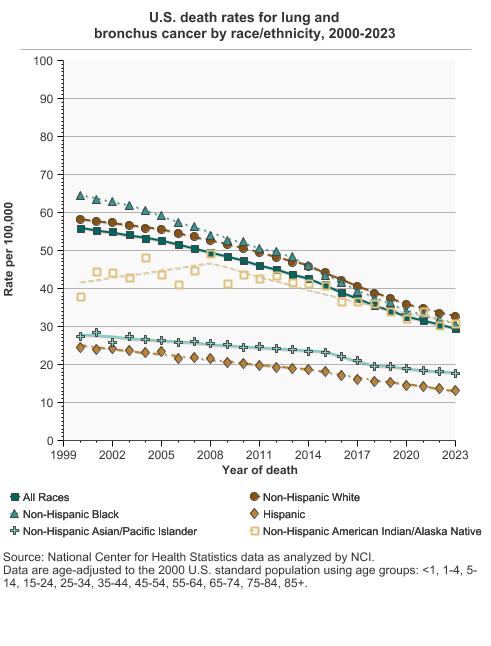
U.S. death rates for lung and bronchus cancer by race/ethnicity, 2000-2023 Overview Graph Detailed Trend Graphs Most Recent Estimates (2023) Rate per 100,000 95% Confidence Interval 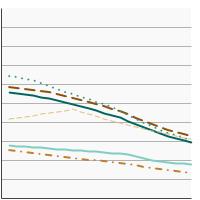
All Races 29.5 29.3 - 29.6 Non-Hispanic White 32.6 32.4 - 32.8 Non-Hispanic Black 30.5 30.0 - 31.1 Hispanic 13.1 12.7 - 13.4 Non-Hispanic Asian/Pacific Islander 17.7 17.2 - 18.3 Non-Hispanic American Indian/Alaska Native 30.8 28.2 - 33.5 - Female Breast Cancer by Race/Ethnicity
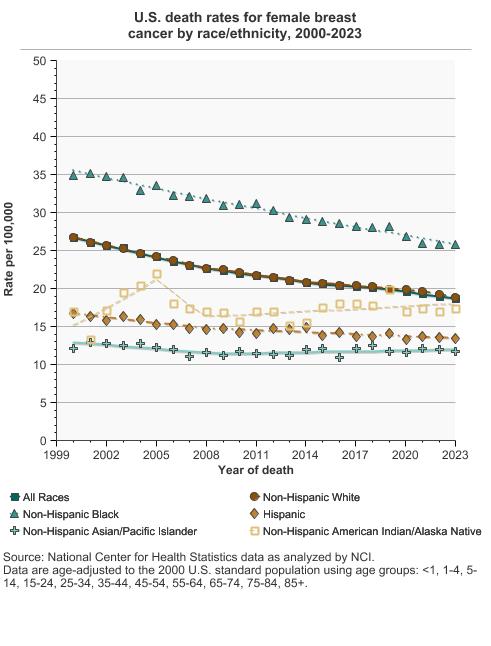
U.S. death rates for female breast cancer by race/ethnicity, 2000-2023 Overview Graph Detailed Trend Graphs Most Recent Estimates (2023) Rate per 100,000 95% Confidence Interval 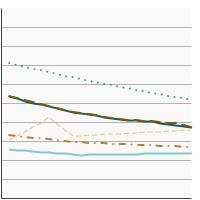
All Races 18.6 18.5 - 18.8 Non-Hispanic White 18.8 18.6 - 19.0 Non-Hispanic Black 25.8 25.2 - 26.5 Hispanic 13.4 13.0 - 13.9 Non-Hispanic Asian/Pacific Islander 11.7 11.1 - 12.3 Non-Hispanic American Indian/Alaska Native 17.4 14.8 - 20.4 - Prostate Cancer by Race/Ethnicity
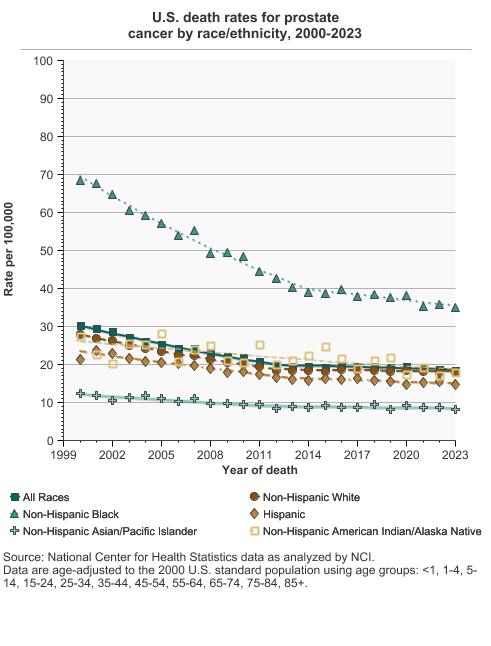
U.S. death rates for prostate cancer by race/ethnicity, 2000-2023 Overview Graph Detailed Trend Graphs Most Recent Estimates (2023) Rate per 100,000 95% Confidence Interval 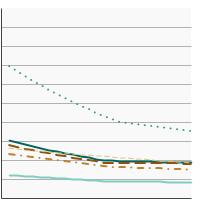
All Races 18.5 18.3 - 18.7 Non-Hispanic White 17.8 17.5 - 18.0 Non-Hispanic Black 35.1 34.1 - 36.1 Hispanic 14.8 14.2 - 15.4 Non-Hispanic Asian/Pacific Islander 8.1 7.5 - 8.6 Non-Hispanic American Indian/Alaska Native 17.9 14.7 - 21.5
- Recent Trends for Common Cancer Sites
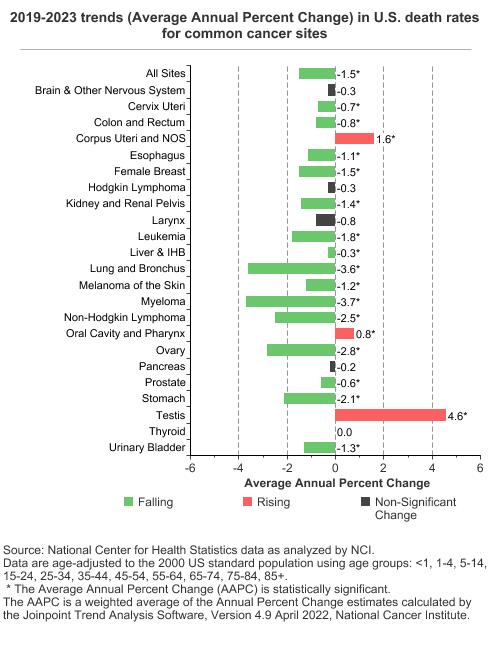
2019-2023 trends (Average Annual Percent Change) in U.S. death rates for common cancer sites Overview graph Cancer Site Average Annual Percent Change 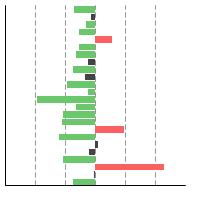
All Sites -1.5* Brain and ONS -0.3 Cervix Uteri -0.7* Colon and Rectum -0.8* Corpus Uteri and NOS 1.6* Esophagus -1.1* Female Breast -1.5* Hodgkin Lymphoma -0.3 Kidney and Renal Pelvis -1.4* Larynx -0.8* Leukemia -1.8* Liver and IBD -0.3 Lung and Bronchus -3.6* Melanoma of the Skin -1.2* Myeloma -3.7* Non-Hodgkin Lymphoma -2.5* Oral Cavity and Pharynx 0.8* Ovary -2.8* Pancreas 0.2 Prostate -0.6* Stomach -2.1* Testis 4.6* Thyroid 0.0 Urinary Bladder -1.3* * The Average Annual Percent Change (AAPC) is statistically significant.
Additional Information
- Advanced Cancer. National Cancer Institute.
- End-of-Life Care for People Who Have Cancer. National Cancer Institute.
- Hospice Care. National Cancer Institute.
- Advance Directives. American Cancer Society.
- Hospice Care. American Cancer Society.
- Nearing the End of Life. American Cancer Society.
- Planning the Transition to End-of-Life Care in Advanced Care (PDQ®)-Health Professional Version. National Cancer Institute.
- Resources for Health Professionals. National Cancer Institute.
Scientific reports
- Annual Report to the Nation on the Status of Cancer. National Cancer Institute.
- SEER*Explorer: An interactive website that provides easy access to a wide range of SEER cancer statistics. National Cancer Institute.
- State Cancer Profiles. National Cancer Institute.
- Cancer Facts and Figures. American Cancer Society.
- Colorectal Cancer Mortality Projection. Cancer Intervention Surveillance Network.
- National Vital Statistics System—Mortality Data. . Centers for Disease Control and Prevention.