On This Page:
- Background
- Measure
- Healthy People 2030 Target
- Data Source
- Trends and Most Recent Estimates
- Additional Information

Background
Adopting or maintaining a healthy lifestyle after a cancer diagnosis has the potential to reduce both cancer- and non-cancer-related morbidity and mortality. Preventing excess body weight and obesity can enhance the length and health-related quality of life of cancer survivors, and it can reduce the risk of developing cancers that have been linked to excess body weight, including colorectal, breast (among women who have gone through menopause), endometrial, esophageal, renal cell (kidney), and pancreatic cancer.
As the number of cancer survivors grows and expected survival time increases, the health behaviors of these individuals are becoming an important focus of attention.
Measure
Rates of cancer survivors with obesity are based on the self-reporting of individuals with a cancer history, who are interviewed as part of the annual population-based National Health Interview Survey (NHIS). Weight groups are defined by a measurement called body mass index (BMI), which is calculated by dividing weight in kilograms by height in meters, squared. For most adults, experts consider a BMI of 30 and above as having obesity.
Data Source
Centers for Disease Control and Prevention, National Center for Health Statistics. National Health Interview Survey, 1992–2023.
Refer to the Data Sources page for more information about data collection years 2019+.
Healthy People 2030 Target
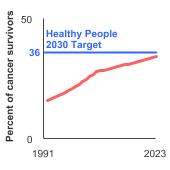
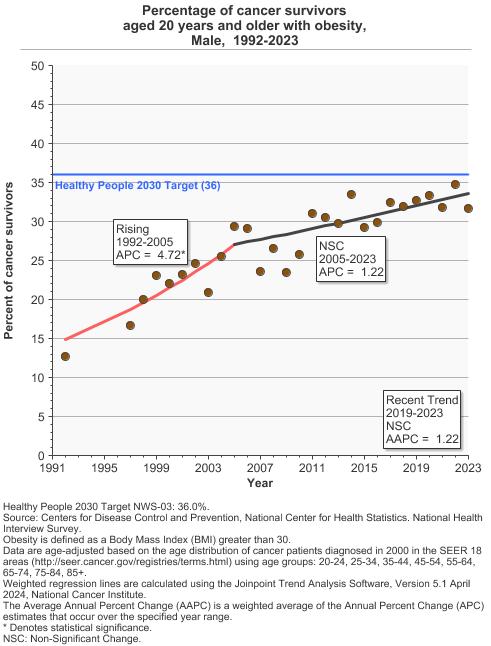
- There is no Healthy People 2030 target for obesity rates among cancer survivors, though Healthy People does include a national objective to increase the mental and physical health-related quality of life of cancer survivors; however, the goal for the general population is to reduce the proportion of adults with obesity to 36.0 percent.
- Healthy People 2030 Targets are developed and based on the general population and do not account for differences in the age distribution of cancer survivors compared to the general population. Cancer survivors are typically older than those in the general population who have not had cancer.
Healthy People 2030 is a set of goals set forth by the Department of Health and Human Services.
Note: Goals are indicated as blue line on Detailed Trend Graphs.
Trends and Most Recent Estimates
- Overweight
- By Sex
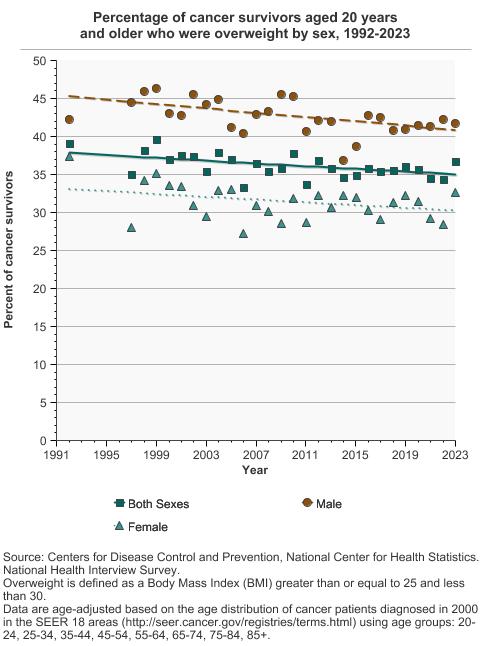
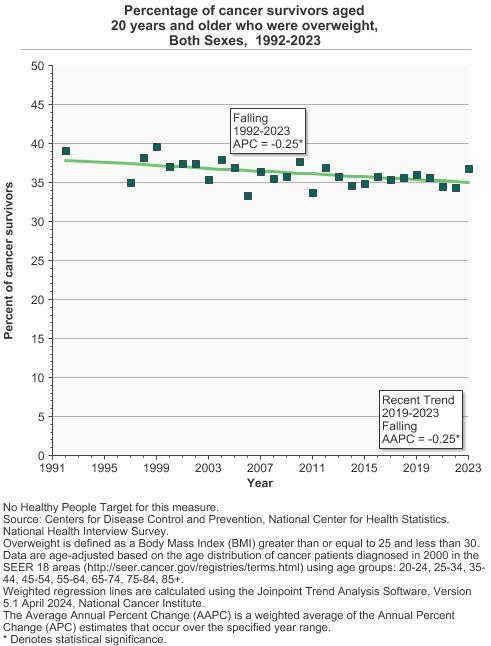
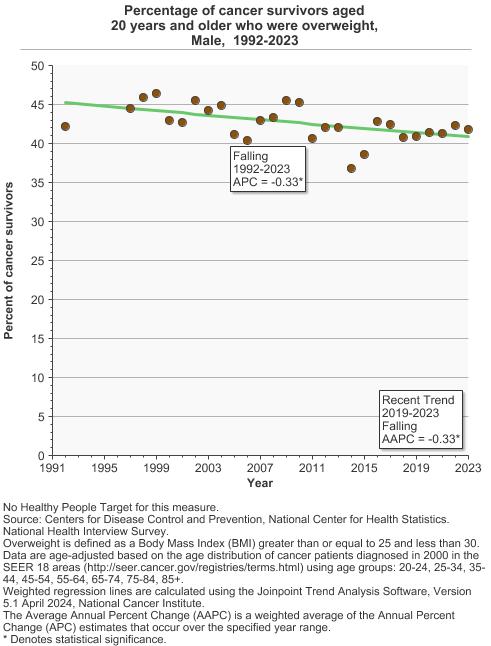
Percentage of cancer survivors aged 20 years and older who were overweight by sex, 1992-2023 Overview Graph Detailed Trend Graphs Most Recent Estimates (2023) Percent of cancer survivors 95% Confidence Interval 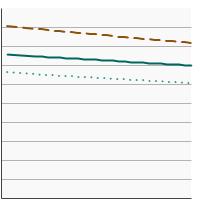

Both Sexes 
36.7 34.8 - 38.7 Male 41.8 38.6 - 45.0 Female 32.7 30.1 - 35.4 - By Time Since Cancer Diagnosis
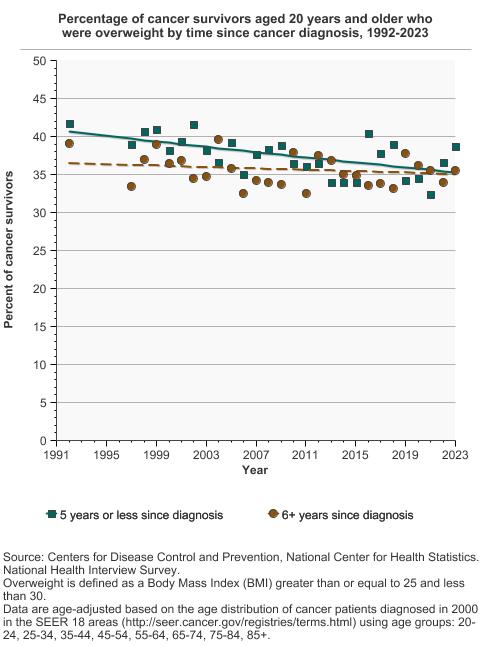
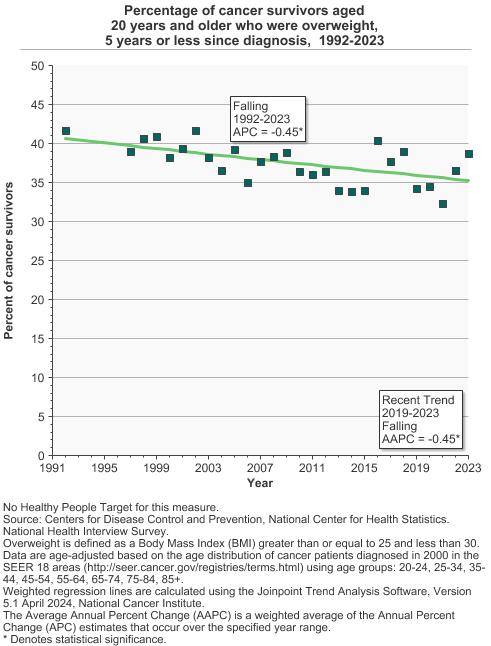
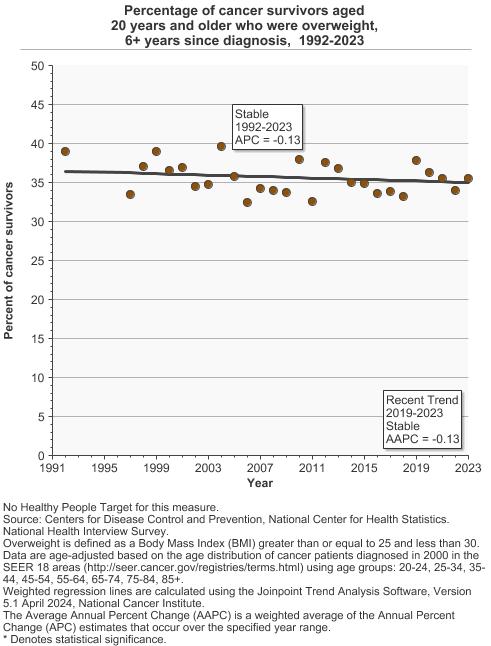
Percentage of cancer survivors aged 20 years and older who were overweight by time since cancer diagnosis, 1992-2023 Overview Graph Detailed Trend Graphs Most Recent Estimates (2023) Percent of cancer survivors 95% Confidence Interval 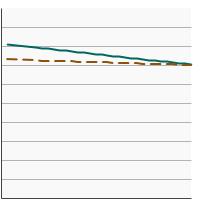
5 years or less since diagnosis 38.7 35.4 - 42.1 6+ years since diagnosis 35.5 33.0 - 38.2 - Compared to Remaining U.S. Population
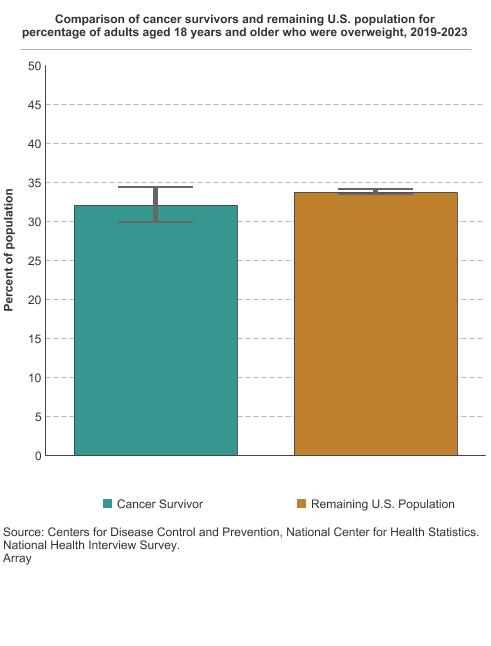
Comparison of cancer survivors and remaining U.S. population for percentage of adults aged 18 years and older who were overweight, 2019-2023 Overview graph Age Group Cancer Survivor Remaining U.S. Population Percent of population Confidence Interval Percent of population Confidence Interval 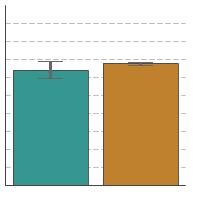
Ages 18 and older 32.1 29.8 - 34.4 33.8 33.4 - 34.1
- Obesity
- By Sex
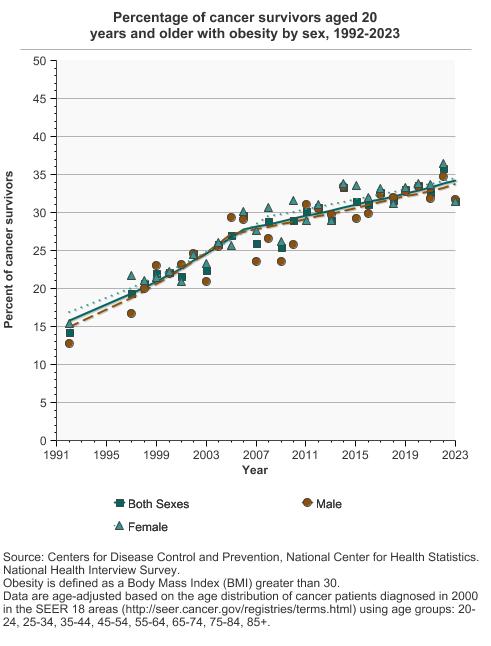
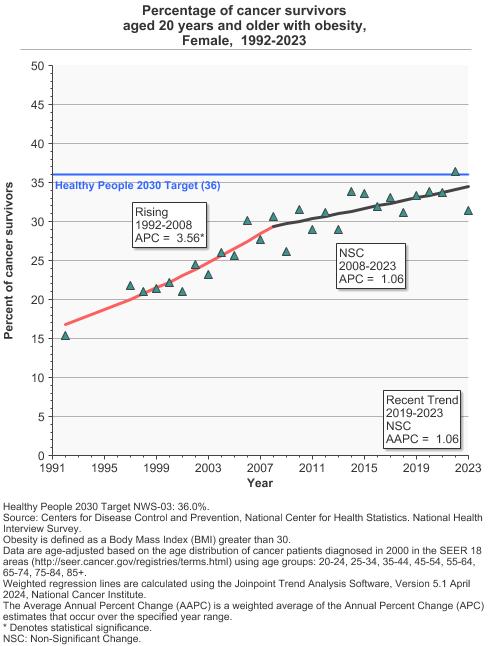
Percentage of cancer survivors aged 20 years and older with obesity by sex, 1992-2023 Overview Graph Detailed Trend Graphs Most Recent Estimates (2023) Percent of cancer survivors 95% Confidence Interval 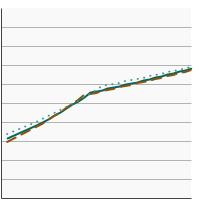
Both Sexes 31.4 29.6 - 33.3 Male 31.7 28.9 - 34.6 Female 31.4 28.9 - 34.0 - By Time Since Cancer Diagnosis
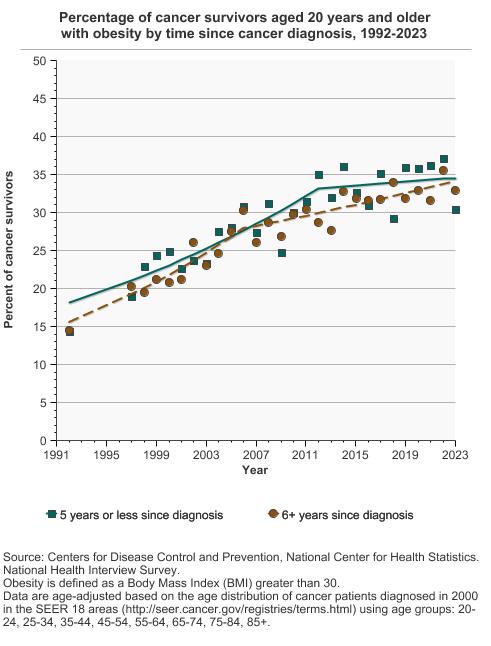
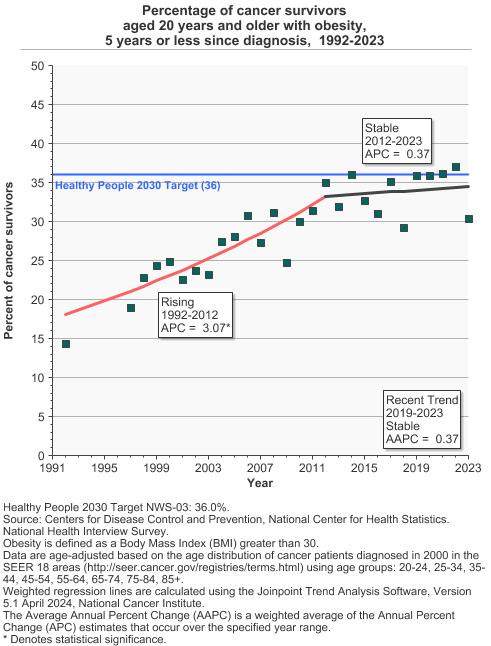
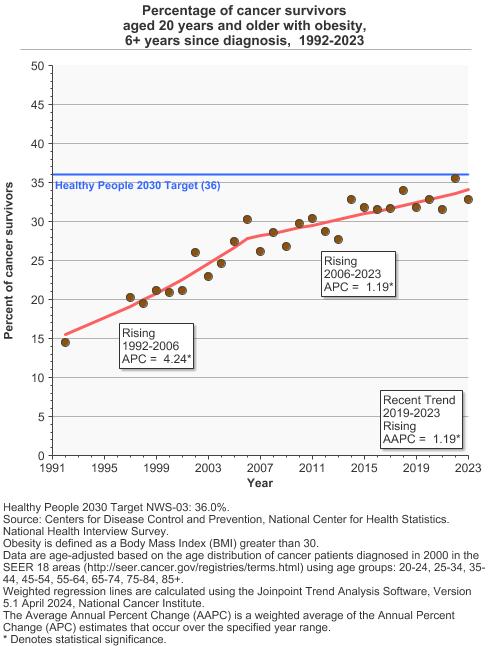
Percentage of cancer survivors aged 20 years and older with obesity by time since cancer diagnosis, 1992-2023 Overview Graph Detailed Trend Graphs Most Recent Estimates (2023) Percent of cancer survivors 95% Confidence Interval 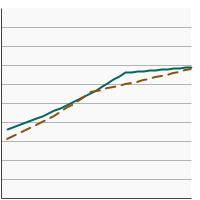
5 years or less since diagnosis 30.4 27.3 - 33.7 6+ years since diagnosis 32.9 30.4 - 35.5 - Compared to Remaining U.S. Population
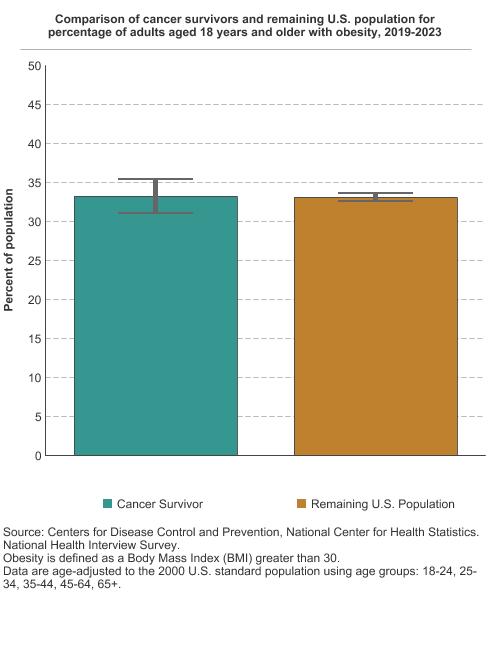
Comparison of cancer survivors and remaining U.S. population for percentage of adults aged 18 years and older with obesity, 2019-2023 Overview graph Age Group Cancer Survivor Remaining U.S. Population Percent of population Confidence Interval Percent of population Confidence Interval 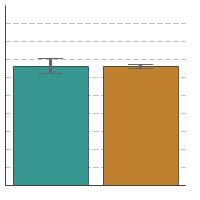
Ages 18 and older 33.2 31.1 - 35.4 33.0 32.5 - 33.5

Additional Information
- Facing Forward: Life After Cancer Treatment. National Cancer Institute.
- Health and Well-Being After a Cancer Diagnosis. National Cancer Institute, Office of Cancer Survivorship.
- Obesity and Cancer. National Cancer Institute.
- Body Weight and Cancer Risk. American Cancer Society.
- Survivorship: During and After Treatment. American Cancer Society.
- Division of Nutrition, Physical Activity, and Obesity. Centers for Disease Control and Prevention.
- Overweight & Obesity. Centers for Disease Control and Prevention.
- Physical Activity for a Healthy Weight. Centers for Disease Control and Prevention.
- Body Mass Index Table. National Heart, Lung, and Blood Institute.
- Overweight and Obesity.. National Heart, Lung, and Blood Institute.
- Obesity Evidence-Based Programs Listing. National Cancer Institute.
- Obesity and Cancer. Centers for Disease Control and Prevention.
- Obesity in Children and Adolescents: Screening (June 2017). U.S. Preventive Services Task Force.
- Weight Loss to Prevent Obesity-Related Morbidity and Mortality in Adults: Behavioral Intervention. U.S. Preventive Services Task Force.
- Weight management and physical activity throughout the cancer care continuum. Demark-Wahnefried W, Schmitz KH, Alfano CM, et al. CA Cancer J Clin. 2018 Jan;68(1):64-89.
- Trends in Obesity Among Adults in the United States, 2005 to 2014. Flegal KM, Kruszon-Moran D, Carroll MD, Fryar CD, Ogden CL. JAMA. 2016 Jun 7;315(21):2284-91.
- Helping Patients Eat Better During and Beyond Cancer Treatment: Continued Nutrition Management Throughout Care to Address Diet, Malnutrition, and Obesity in Cancer. Greenlee H, Santiago-Torres M, McMillen KK, Ueland K, Haase AM. Cancer J. 2019 Sep/Oct;25(5):320-328.
- Obesity, physical activity, and breast cancer survival among older breast cancer survivors in the Cancer Prevention Study-II Nutrition Cohort. Maliniak ML, Patel AV, McCullough ML, et al. Breast Cancer Res Treat. 2017 Aug 31.
- Incorporating Weight Management and Physical Activity Throughout the Cancer Care Continuum: Proceedings of a Workshop. National Academies of Sciences, Engineering, and Medicine. 2018.
- American College of Sports Medicine Roundtable Report on Physical Activity, Sedentary Behavior, and Cancer Prevention and Control. Patel AV, Friedenreich CM, Moore SC, et al. Med Sci Sports Exerc. 2019 Nov;51(11):2391-2402.
- Association of Obesity with Survival Outcomes in Patients with Cancer: A Systematic Review and Meta-analysis. Petrelli F, Cortellini A, Indini A, Tomasello G, Ghidini M, et al. JAMA Network Open. 2021; 4(3): e213520.
- Results of the Exercise and Nutrition to Enhance Recovery and Good Health for You (ENERGY) Trial: A Behavioral Weight Loss Intervention in Overweight or Obese Breast Cancer Survivors. Rock CL, Flatt SW, Byers TE, et al. J Clin Oncol. 2015 Oct 1;33(28):3169-76.
- National Center for Health Statistics – Obesity and Overweight. Centers for Disease Control and Prevention.