On This Page:
- Background
- Measure
- Healthy People 2030 Target
- Data Source
- Trends and Most Recent Estimates
- Additional Information
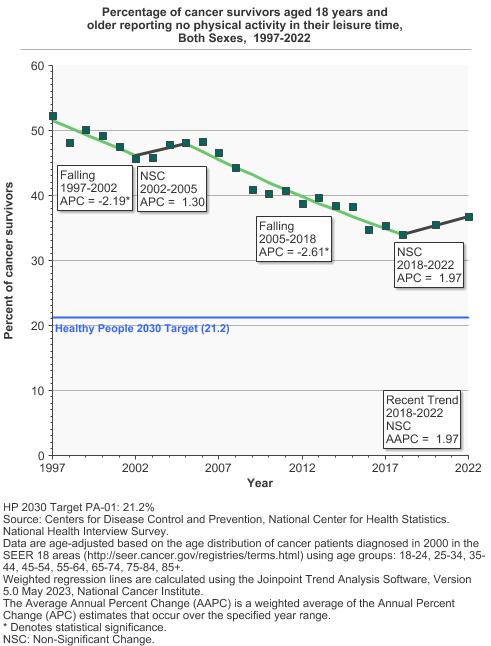
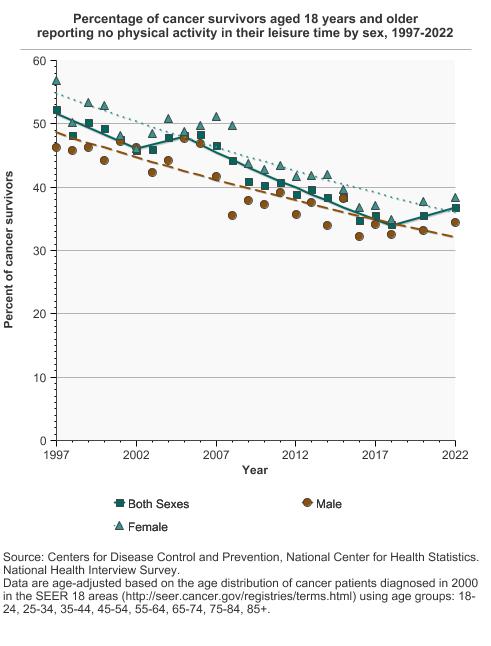
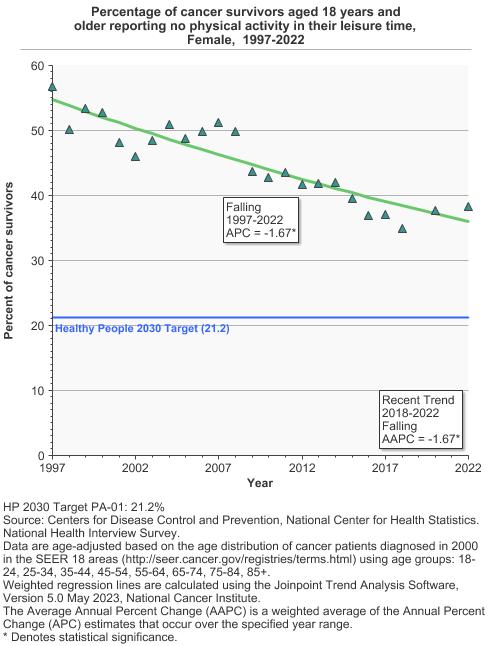
In 2022, 36.7% of cancer survivors aged 18 years and older reported no physical activity in their leisure time.
Background
As the number of cancer survivors grows and expected survival time increases, the health behaviors of these individuals are becoming an important focus of attention. Adoption or maintenance of healthy lifestyles after a cancer diagnosis has the potential to reduce both cancer- and non-cancer-related morbidity and mortality. Tracking these behaviors permits evaluation of how well cancer control efforts are working to reduce unnecessary disability and death among those with a history of cancer.
To enhance the length and health-related quality of life of cancer survivors, efforts are needed to encourage adequate physical activity. Physical activity may improve treatment outcomes and reduce the risk of developing several types of cancer, including breast, colon, and endometrium (lining of the uterus). Being active may also help to prevent weight gain and obesity, reducing the risk of developing cancers that have been linked to excess body weight. In addition to cancer risk, physical activity may also lower a person’s risk of other health problems such as heart disease, high blood pressure, diabetes mellitus, and osteoporosis.
Measure
The percentage of cancer survivors reporting no physical activity are based on the self-reporting of individuals with a cancer history who are interviewed as part of the annual population-based National Health Interview Survey (NHIS). Participants were asked how often they perform light, moderate, or vigorous activity for at least 10 minutes.
Data Source
Centers for Disease Control and Prevention, National Center for Health Statistics. National Health Interview Survey, 1997–2020.
Refer to the Data Sources page for more information about data collection years 2019+.
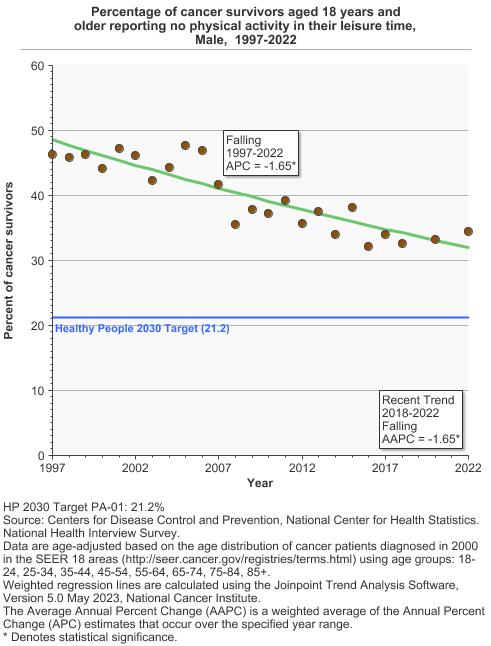
Healthy People 2030 Target
- There is no Healthy People 2030 target for physical activity among cancer survivors, though it does include a national objective to increase the mental and physical health-related quality of life of cancer survivors. However, it is reasonable to set goals determined for the general population, which are to reduce the proportion of adults who engage in no leisure time physical activity to 21.2 percent and increase the proportion of adults who meet the objectives for aerobic physical activity and for muscle-strengthening activity to 28.4 percent.
- Healthy People 2030 Targets are developed and based on the general population and do not account for differences in the age distribution of cancer survivors compared to the general population. Cancer survivors are typically older than those in the general population who have not had cancer.
Healthy People 2030 is a set of goals set forth by the Department of Health and Human Services.
Note: Goals are indicated as blue line on Detailed Trend Graphs.
Trends and Most Recent Estimates
- No Leisure Time Physical Activity
- By Sex
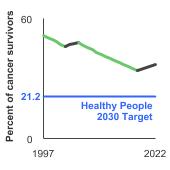
Percentage of cancer survivors aged 18 years and older reporting no physical activity in their leisure time by sex, 1997-2022 Overview Graph Detailed Trend Graphs Most Recent Estimates (2022) Percent of cancer survivors 95% Confidence Interval 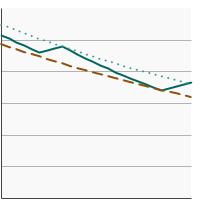

Both Sexes 
36.7 34.6 - 38.9 Male 34.5 31.4 - 37.7 Female 38.3 35.6 - 41.1 - By Age
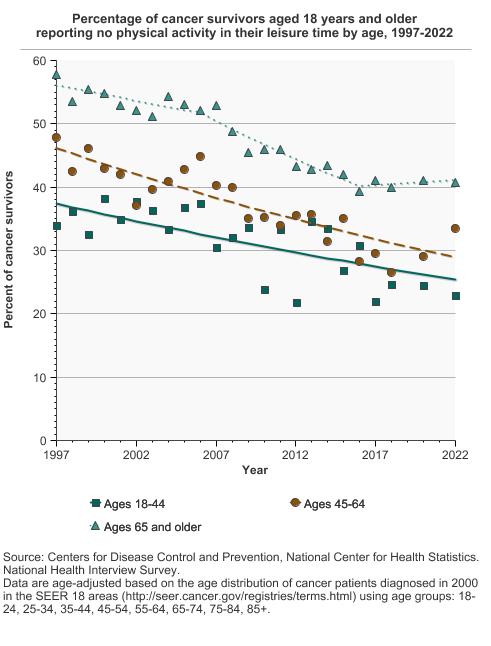
Percentage of cancer survivors aged 18 years and older reporting no physical activity in their leisure time by age, 1997-2022 Overview Graph Detailed Trend Graphs Most Recent Estimates (2022) Percent of cancer survivors 95% Confidence Interval 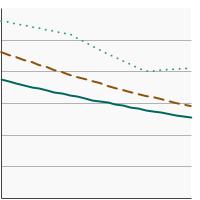
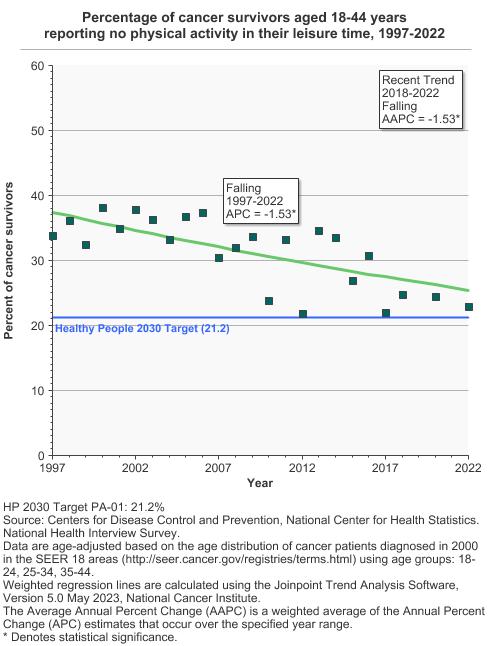
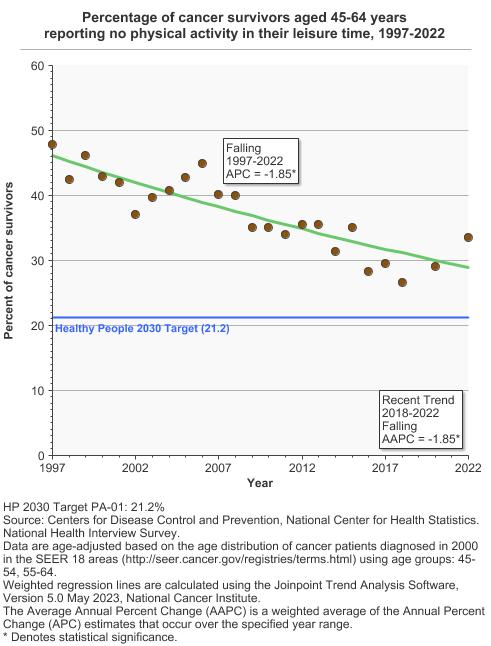
Ages 18-44 23.0 16.7 - 30.6 Ages 45-64 33.5 29.8 - 37.6 Ages 65 and older 40.8 38.3 - 43.3 - By Time Since Cancer Diagnosis
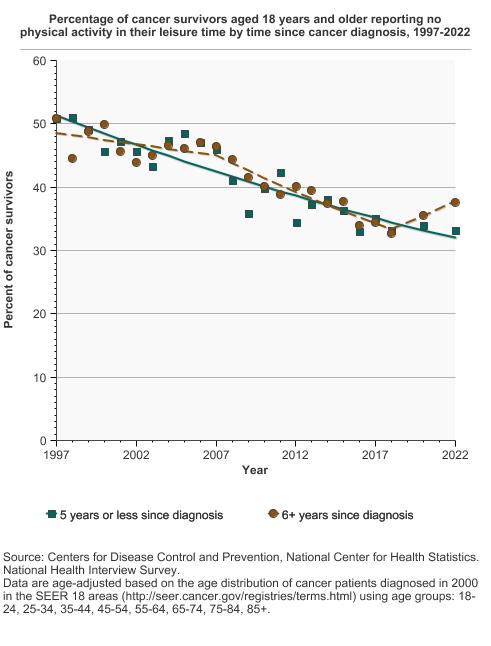
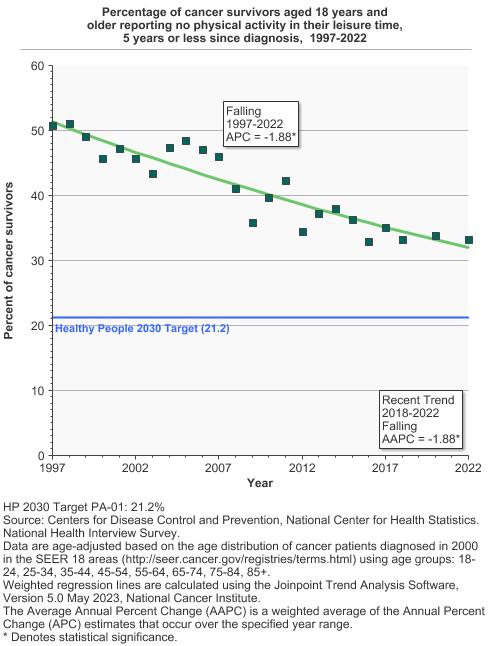
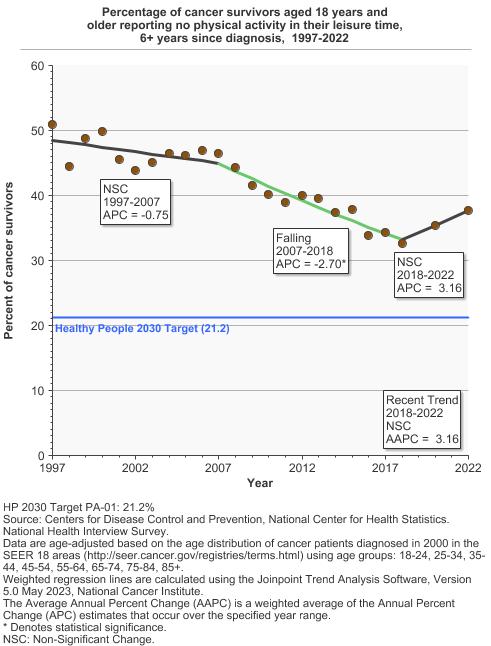
Percentage of cancer survivors aged 18 years and older reporting no physical activity in their leisure time by time since cancer diagnosis, 1997-2022 Overview Graph Detailed Trend Graphs Most Recent Estimates (2022) Percent of cancer survivors 95% Confidence Interval 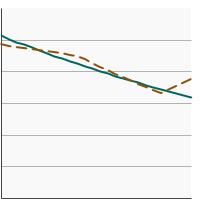
5 years or less since diagnosis 33.2 29.9 - 36.7 6+ years since diagnosis 37.7 34.8 - 40.6 - Compared to Remaining U.S. Population
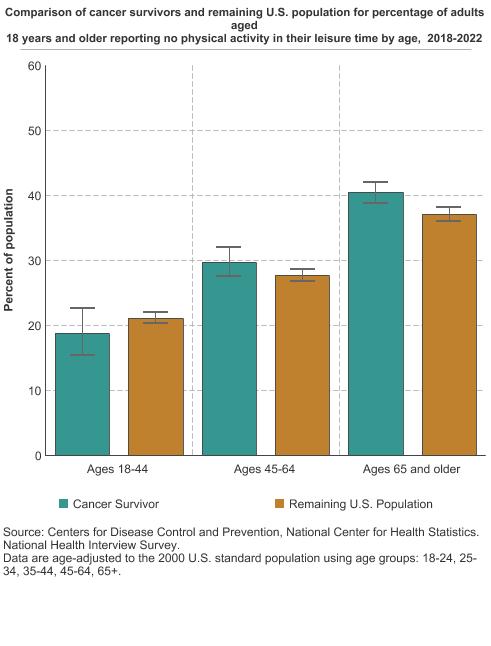
Comparison of cancer survivors and remaining U.S. population for percentage of adults aged 18 years and older reporting no physical activity in their leisure time by age, 2018-2022 Overview graph Age Group Cancer Survivor Remaining U.S. Population Percent of population Confidence Interval Percent of population Confidence Interval 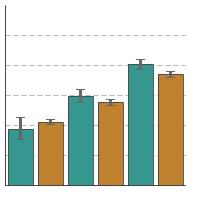
Ages 18-44 18.7 15.4 - 22.6 21.1 20.2 - 21.9 Ages 45-64 29.8 27.6 - 32.0 27.6 26.7 - 28.6 Ages 65 and older 40.4 38.8 - 42.0 37.0 35.9 - 38.1
- Meet Federal Guidelines
- By Sex
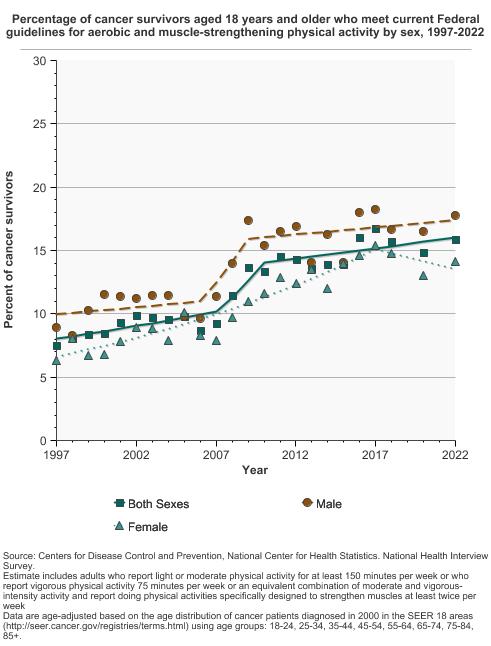
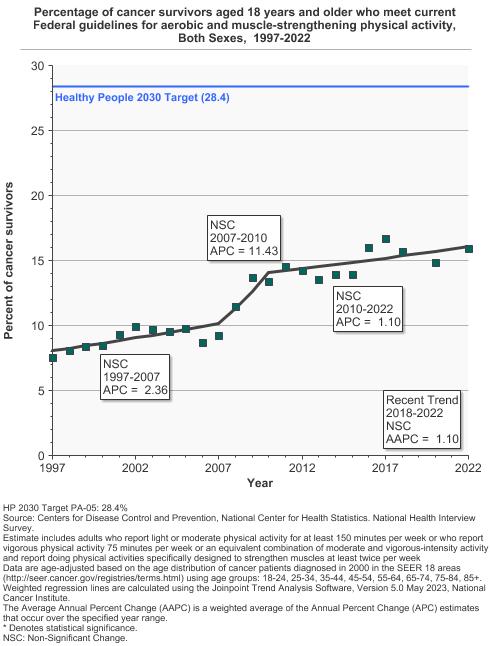
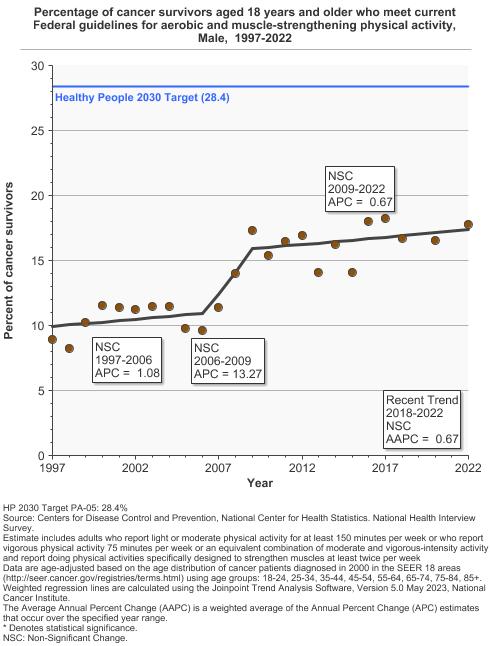
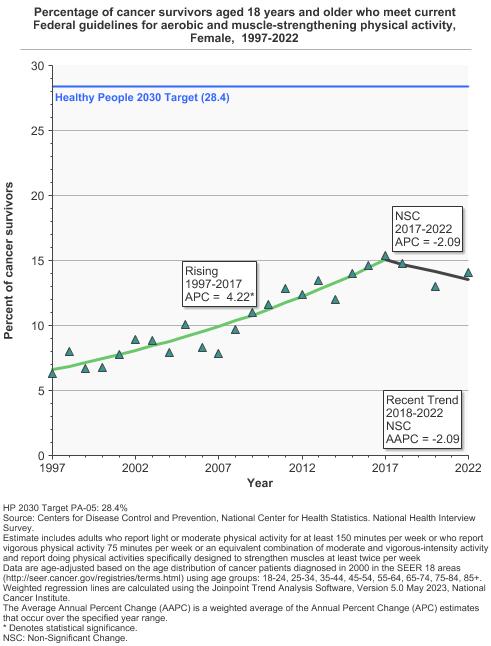
Percentage of cancer survivors aged 18 years and older who meet current Federal guidelines for aerobic and muscle-strengthening physical activity by sex, 1997-2022 Overview Graph Detailed Trend Graphs Most Recent Estimates (2022) Percent of cancer survivors 95% Confidence Interval 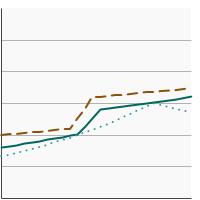
Both Sexes 15.9 14.4 - 17.5 Male 17.8 15.2 - 20.7 Female 14.1 12.3 - 16.1 - By Age
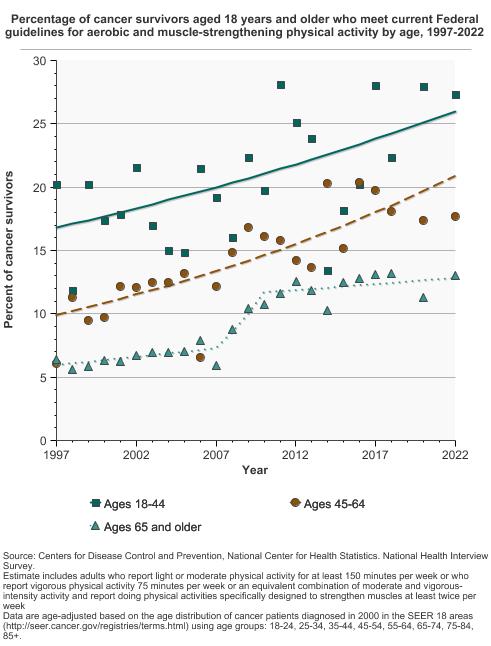
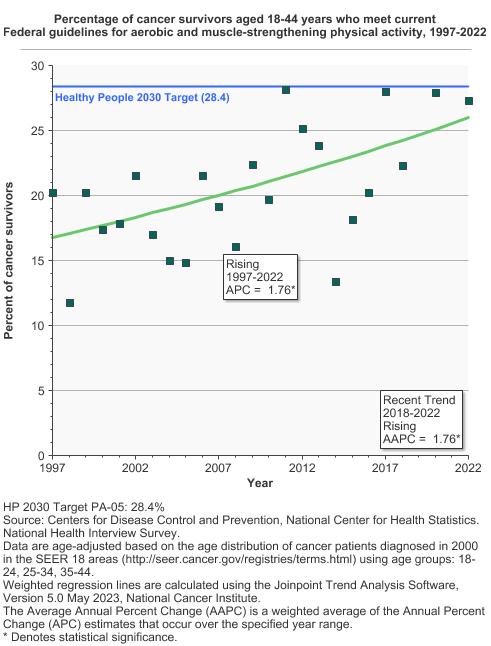
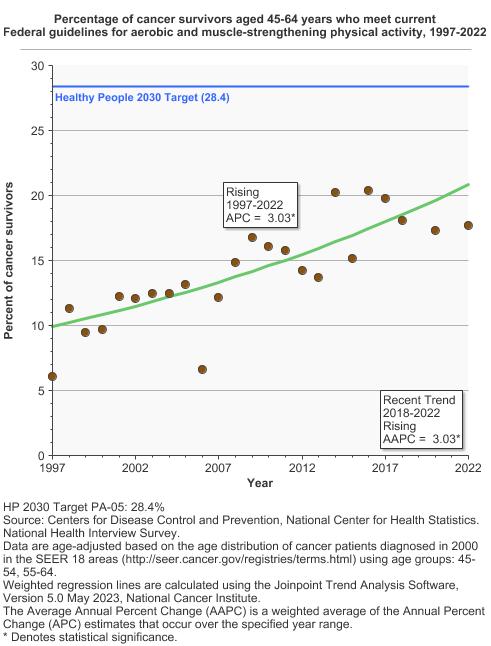
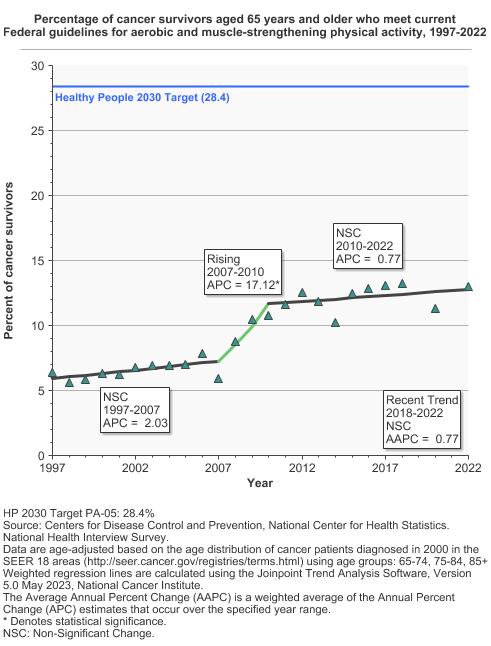
Percentage of cancer survivors aged 18 years and older who meet current Federal guidelines for aerobic and muscle-strengthening physical activity by age, 1997-2022 Overview Graph Detailed Trend Graphs Most Recent Estimates (2022) Percent of cancer survivors 95% Confidence Interval 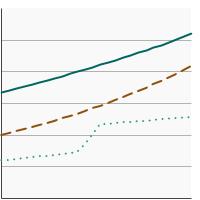
Ages 18-44 27.3 21.1 - 34.5 Ages 45-64 17.7 14.7 - 21.1 Ages 65 and older 13.0 11.5 - 14.7 - By Time Since Cancer Diagnosis
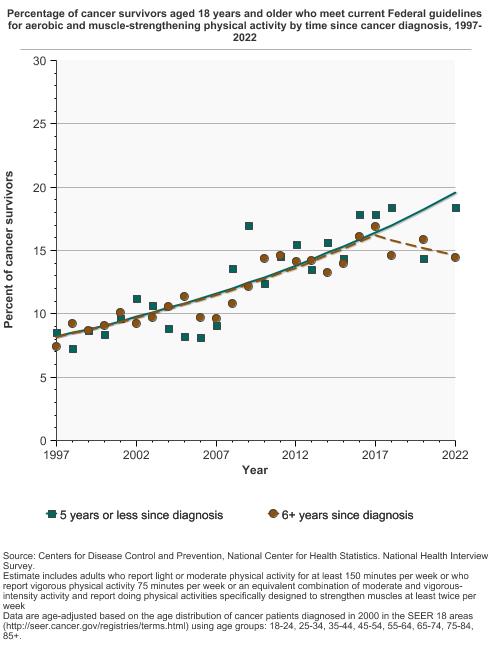
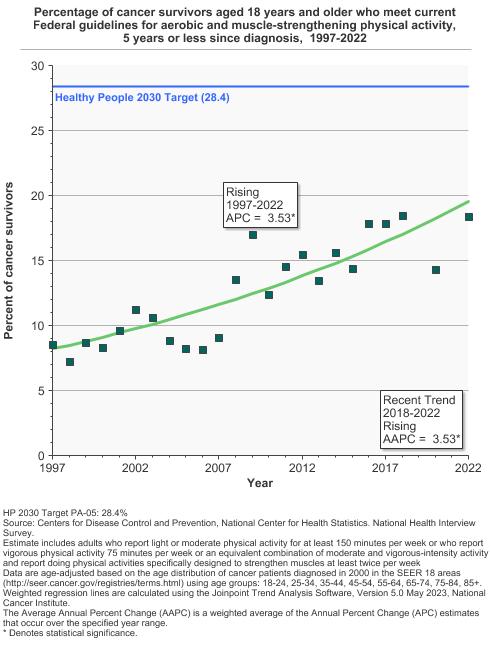
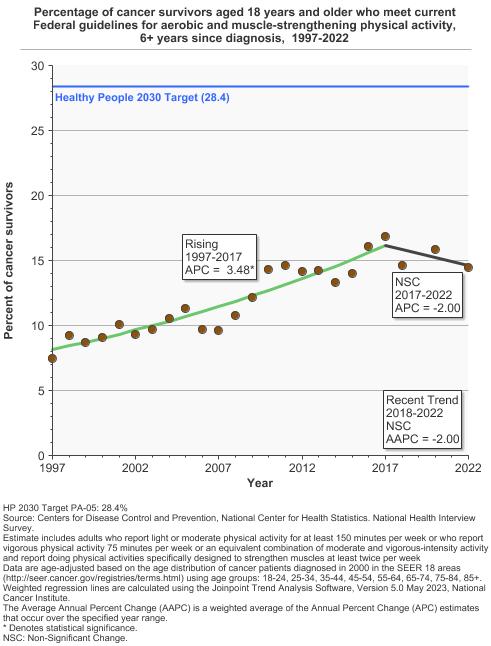
Percentage of cancer survivors aged 18 years and older who meet current Federal guidelines for aerobic and muscle-strengthening physical activity by time since cancer diagnosis, 1997-2022 Overview Graph Detailed Trend Graphs Most Recent Estimates (2022) Percent of cancer survivors 95% Confidence Interval 
5 years or less since diagnosis 18.4 15.6 - 21.6 6+ years since diagnosis 14.4 12.7 - 16.3 - Compared to Remaining U.S. Population
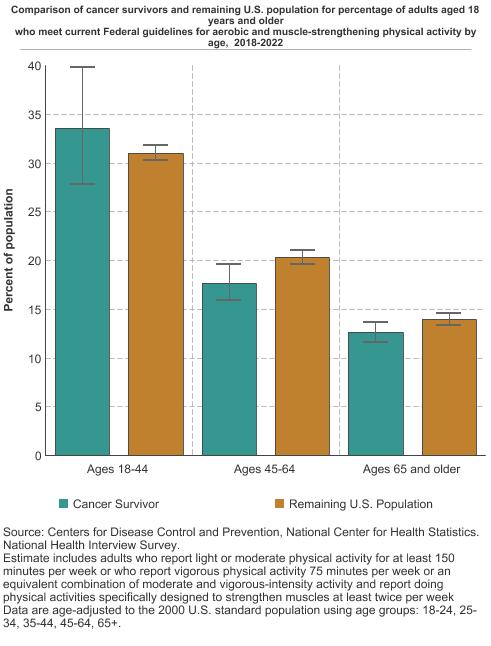
Comparison of cancer survivors and remaining U.S. population for percentage of adults aged 18 years and older who meet current Federal guidelines for aerobic and muscle-strengthening physical activity by age, 2018-2022 Overview graph Age Group Cancer Survivor Remaining U.S. Population Percent of population Confidence Interval Percent of population Confidence Interval 
Ages 18-44 33.5 27.8 - 39.8 31.0 30.2 - 31.8 Ages 45-64 17.7 15.9 - 19.6 20.3 19.6 - 21.0 Ages 65 and older 12.6 11.6 - 13.7 13.9 13.3 - 14.6

Additional Information
- Facing Forward: Life After Cancer Treatment. National Cancer Institute.
- Health and Well-Being After a Cancer Diagnosis. National Cancer Institute.
- Physical Activity and Cancer. National Cancer Institute.
- Physical Activity and the Person with Cancer. American Cancer Society.
- Living Beyond Cancer. National Coalition for Cancer Survivorship.
- Physical Activity Evidence-Based Programs Listing. National Cancer Institute.
- Exercise Guidelines for Cancer Survivors: Consensus Statement from International Multidisciplinary Roundtable. Campbell KL, Winters-Stone KM, Wiskemann J, et al. Med Sci Sports Exerc. 2019 Nov;51(11):2375-2390.
- Pre- to postdiagnosis leisure-time physical activity and prognosis in postmenopausal breast cancer survivors. Jung AY, Behrens S, Schmidt M, et al. Breast Cancer Res. 2019 Nov 7;21(1):117.
- The dose-response effect of physical activity on cancer mortality: findings from 71 prospective cohort studies. Li T, Wei S, Shi Y, et al. Br J Sports Med. 2016 Mar;50(6):339-45. doi: 10.1136/bjsports-2015-094927. Review.
- Posttreatment trajectories of physical activity in breast cancer survivors. Lucas AR, Levine BJ, Avis NE. Cancer. 2017 Jul 15;123(14):2773-2780.
- The effectiveness of exercise interventions for improving health-related quality of life from diagnosis through active cancer treatment. Mishra SI, Scherer RW, Snyder C, et al. Oncol Nurs Forum. 2015 Jan;42(1):E33-53. doi: 10.1188/15.ONF.E33-E53. Review.
- Childhood Cancer and Functional Impacts Across the Care Continuum. National Academies of Sciences, Engineering, and Medicine. 2021.
- Incorporating Weight Management and Physical Activity Throughout the Cancer Care Continuum: Proceedings of a Workshop. National Academies of Sciences, Engineering, and Medicine. 2018.
- Results of the Exercise and Nutrition to Enhance Recovery and Good Health for You (ENERGY) Trial: A Behavioral Weight Loss Intervention in Overweight or Obese Breast Cancer Survivors. Rock CL, Flatt SW, Byers TE, et al. J Clin Oncol. 2015 Oct 1;33(28):3169-76.
- Exercise is medicine in oncology: Engaging clinicians to help patients move through cancer. Schmitz KH, Campbell AM, Stuiver MM, et al. CA Cancer J Clin. 2019 Nov;69(6):468-484.
- The Role of Physical Activity in Managing Fatigue in Cancer Survivors. Serdà I Ferrer BC, van Roekel E, Lynch BM. Curr Nutr Rep. 2018 Sep;7(3):59-69.
- Postdiagnosis sedentary behavior and health outcomes in cancer survivors: A systematic review and meta-analysis. Swain CTV, Nguyen NH, Eagles T, et al. Cancer. 2019 Nov 12.
- Interventions for promoting habitual exercise in people living with and beyond cancer. Turner RR, Steed L, Quirk H, et al. Cochrane Database Syst Rev. 2018 Sep 19;9:CD010192.