On This Page:
- Background
- Measure
- Healthy People 2030 Target
- Data Source
- Trends and Most Recent Estimates
- Related Cancers
- Additional Information
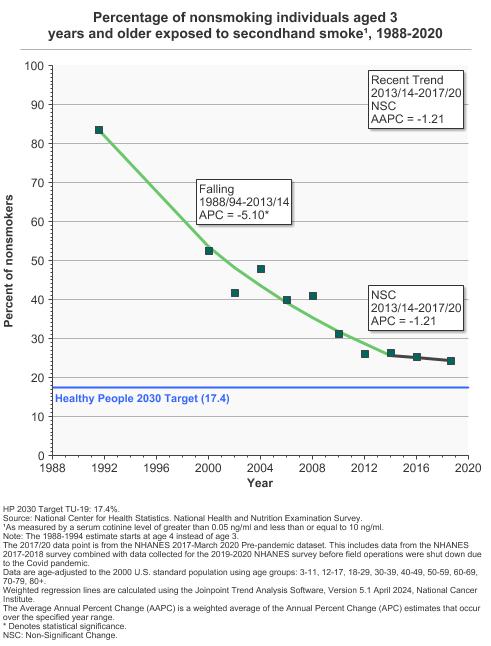
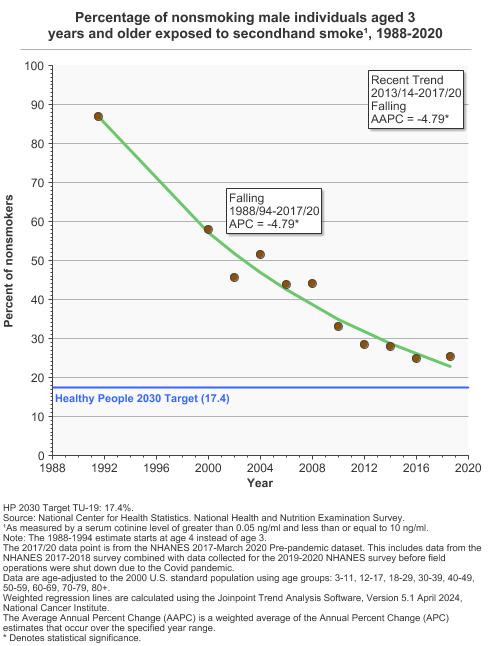
From 2017 to 2020, 24.3% of persons aged 3 years and older were currently exposed to second-hand smoke.
Background
Secondhand smoke (SHS) is a mixture of the sidestream smoke released by a smoldering cigarette, pipe, hookah/waterpipe, or cigar, and the mainstream smoke exhaled by a person who is smoking. SHS is a complex mixture containing thousands of chemicals, including formaldehyde, cyanide, carbon monoxide, ammonia, and nicotine. More than 250 of the chemicals in SHS are known to be harmful, and at least 69 are known to cause cancer.
Conclusive scientific evidence documents that SHS causes premature death and disease in children and adults who do not smoke. Among adults, exposure to SHS has immediate adverse effects on the cardiovascular system, and long-term exposure to SHS causes coronary heart disease, stroke, and lung cancer. Children exposed to SHS are at increased risk for sudden infant death syndrome, acute respiratory infections, middle ear disease, more severe asthma, respiratory symptoms, and slowed lung growth.
There is no risk-free level of exposure to SHS, and eliminating smoking in indoor spaces is the only way to fully protect people who do not smoke from exposure to SHS. Exposure to SHS among nonsmoking persons can be assessed by measurement of cotinine, a metabolite of nicotine. While cotinine levels may vary by individual due to the speed of nicotine metabolism and cotinine clearance, detection of cotinine above a minimum threshold is a validated measure of exposure to SHS in people who do not smoke.
Measure
The percentage of nonsmoking persons exposed to secondhand smoke. (The percentage of nonsmoking persons aged 3 years and older with a serum cotinine level greater than 0.05 ng/mL and less than or equal to 10 ng/mL.)
Data Source
Centers for Disease Control and Prevention, National Center for Health Statistics, National Health and Nutrition Examination Survey (NHANES).
The NHANES 2017-2018 data point was replaced with the NHANES 2017-March 2020 Pre-pandemic data point. More information is available at NHANES Questionnaires, Datasets, and Related Documentation.
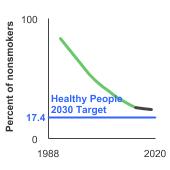
Healthy People 2030 Target
- Reduce the proportion of people who do not smoke but are exposed to secondhand smoke to 17.4%.
Healthy People 2030 is a set of goals set forth by the Department of Health and Human Services.
Note: Goals are indicated as blue line on Detailed Trend Graphs.
Trends and Most Recent Estimates
- By Sex
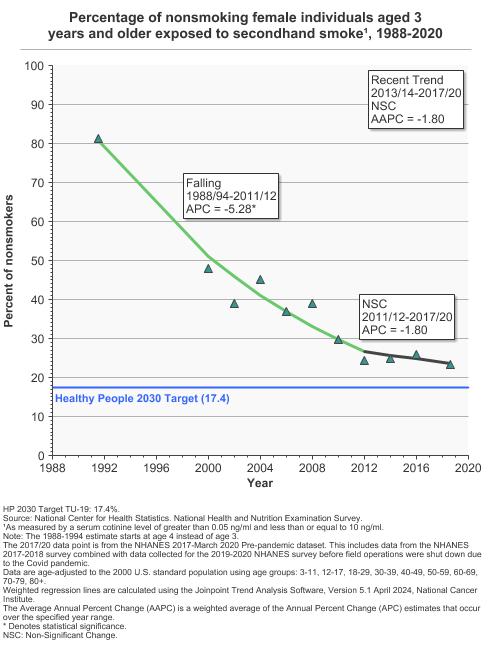
Percentage of nonsmoking individuals aged 3 years and older exposed to secondhand smoke¹ by sex, 1988-2020 Overview Graph Detailed Trend Graphs Most Recent Estimates (2017 to 2020) Percent of nonsmokers 95% Confidence Interval 

Both Sexes 
24.3 22.2 - 26.5 Male 25.5 22.5 - 28.5 Female 23.3 21.1 - 25.4 ¹As measured by a serum cotinine level of greater than 0.05 ng/ml and less than or equal to 10 ng/ml. The 2017 to 2020 data point is from the NHANES 2017-March 2020 Pre-pandemic dataset. This includes data from the NHANES 2017-2018 survey combined with data collected for the 2019-2020 NHANES survey before field operations were shut down due to the Covid pandemic. - By Race/Ethnicity
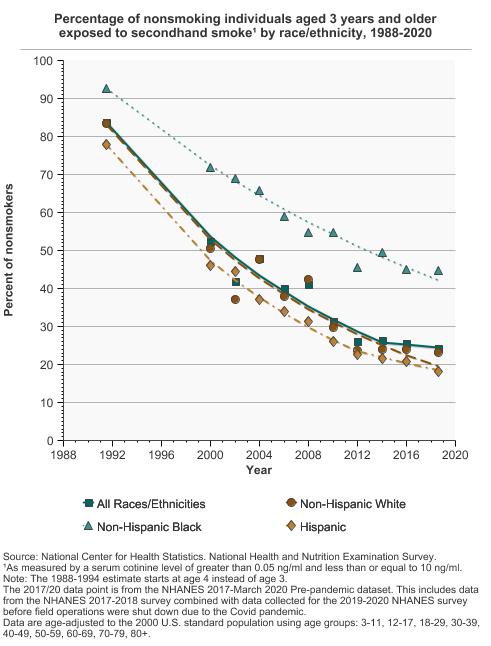
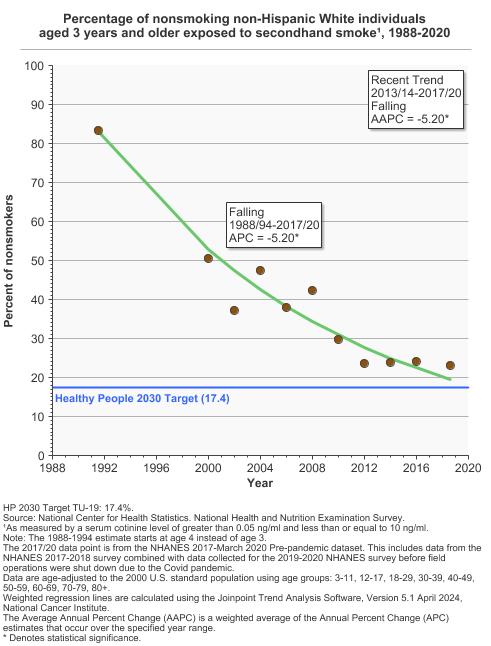
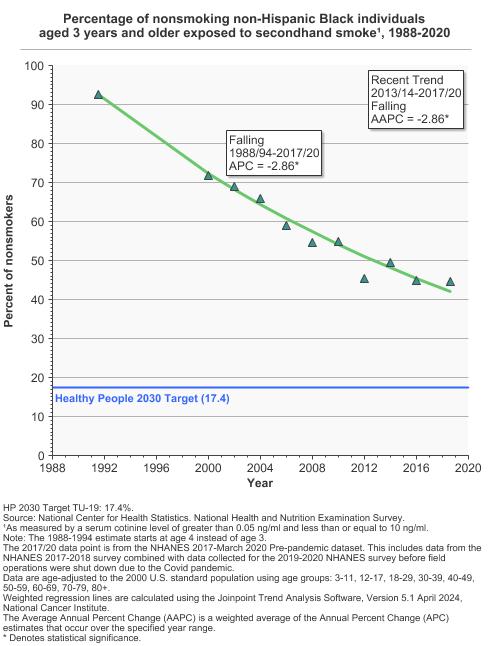
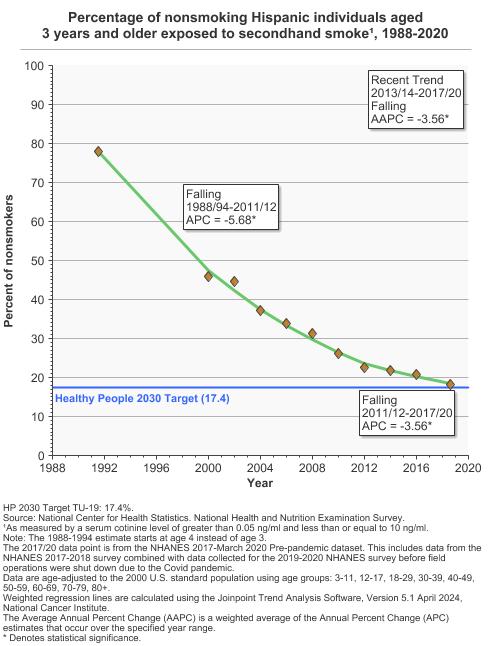
Percentage of nonsmoking individuals aged 3 years and older exposed to secondhand smoke¹ by race/ethnicity, 1988-2020 Overview Graph Detailed Trend Graphs Most Recent Estimates (2017 to 2020) Percent of nonsmokers 95% Confidence Interval 
All Races/Ethnicities 24.3 22.2 - 26.5 Non-Hispanic White 23.1 19.8 - 26.4 Non-Hispanic Black 44.7 40.0 - 49.5 Hispanic 18.3 15.2 - 21.4 ¹As measured by a serum cotinine level of greater than 0.05 ng/ml and less than or equal to 10 ng/ml. The 2017 to 2020 data point is from the NHANES 2017-March 2020 Pre-pandemic dataset. This includes data from the NHANES 2017-2018 survey combined with data collected for the 2019-2020 NHANES survey before field operations were shut down due to the Covid pandemic. - By Age
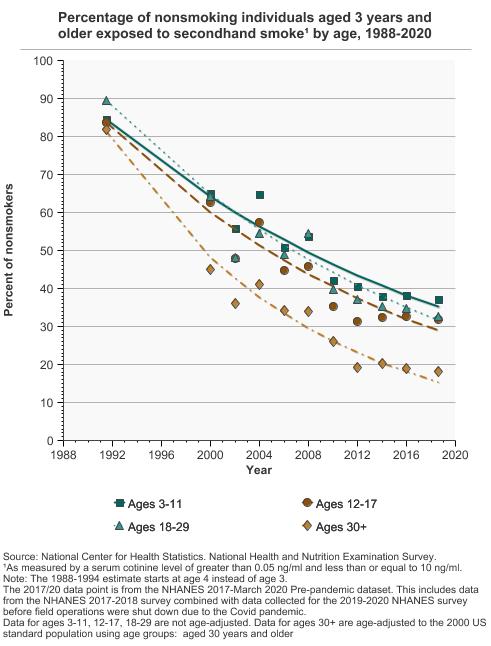
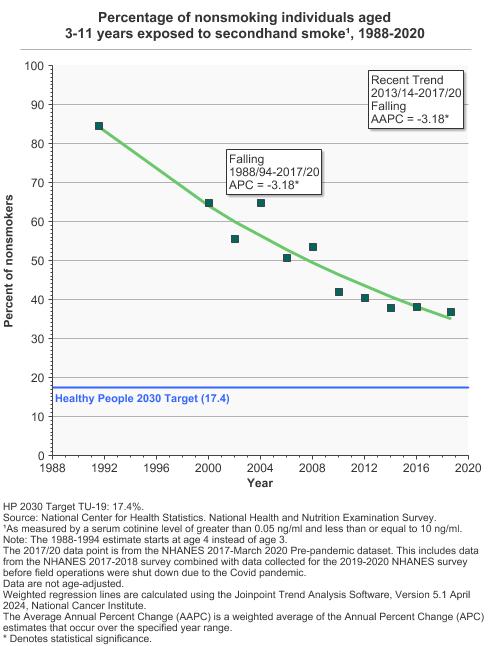
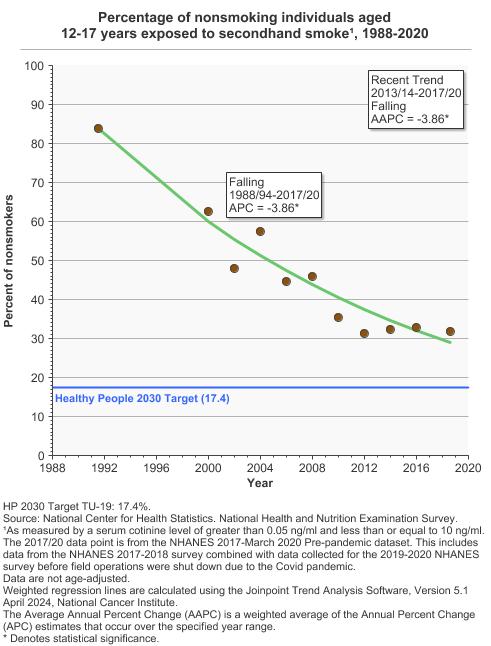
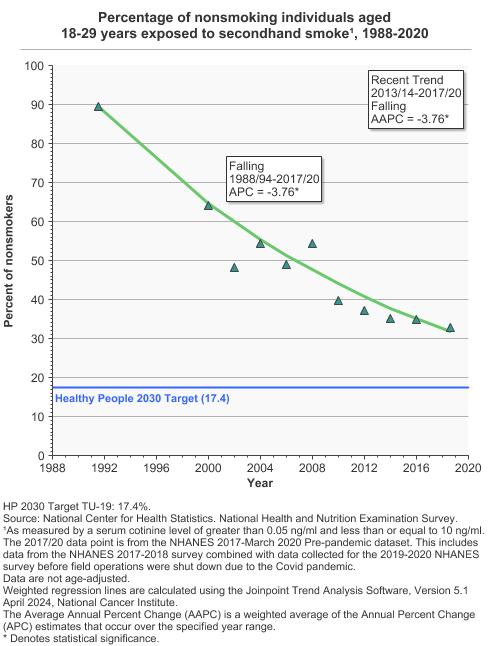
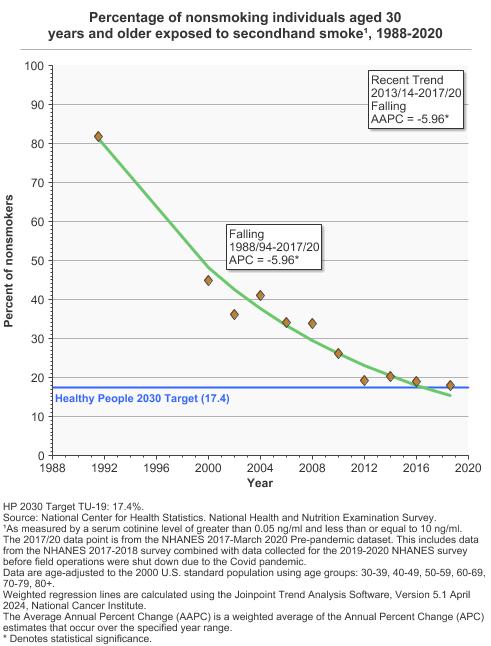
Percentage of nonsmoking individuals aged 3 years and older exposed to secondhand smoke¹ by age, 1988-2020 Overview Graph Detailed Trend Graphs Most Recent Estimates (2017 to 2020) Percent of nonsmokers 95% Confidence Interval 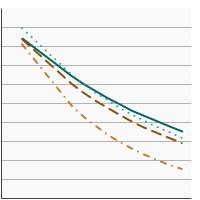
Ages 3-11 37.0 33.5 - 40.5 Ages 12-17 31.8 27.3 - 36.2 Ages 18-29 32.8 28.6 - 36.9 Ages 30+ 18.1 15.9 - 20.2 ¹As measured by a serum cotinine level of greater than 0.05 ng/ml and less than or equal to 10 ng/ml. The 2017 to 2020 data point is from the NHANES 2017-March 2020 Pre-pandemic dataset. This includes data from the NHANES 2017-2018 survey combined with data collected for the 2019-2020 NHANES survey before field operations were shut down due to the Covid pandemic. - By Poverty Income Level
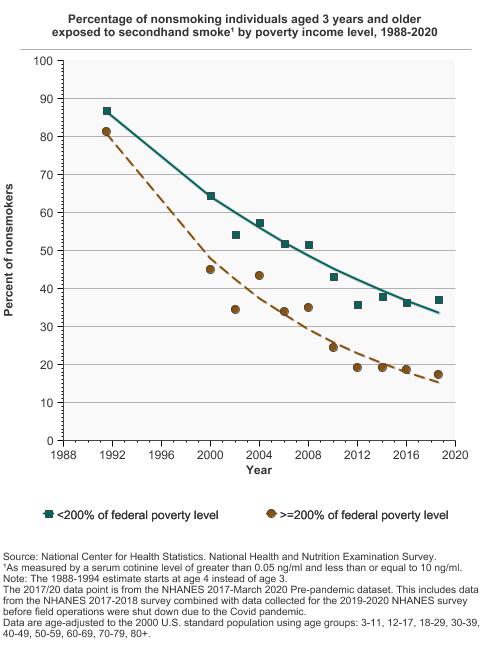
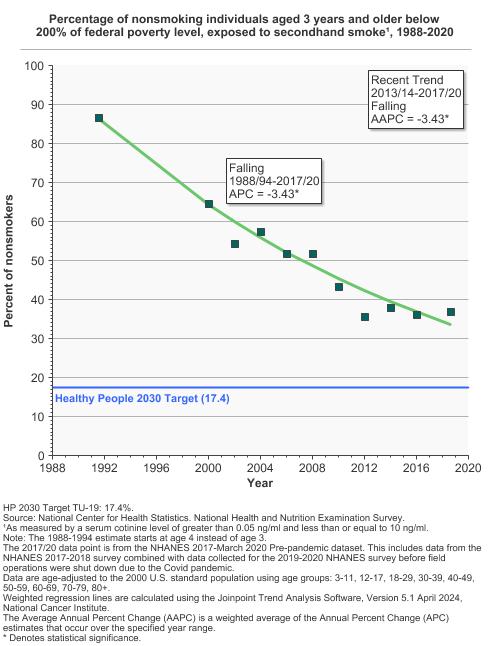
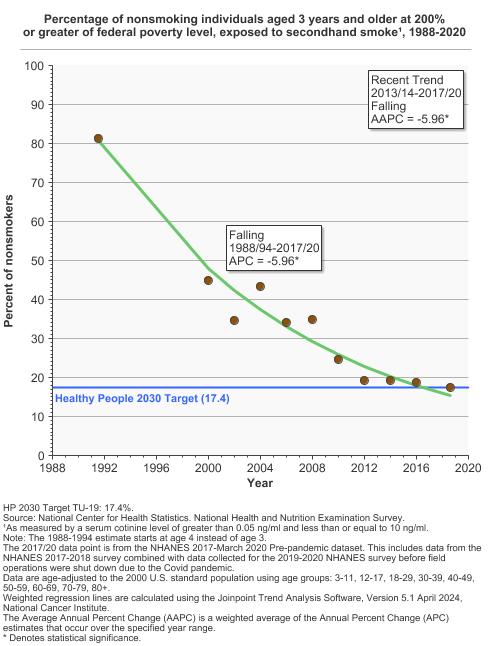
Percentage of nonsmoking individuals aged 3 years and older exposed to secondhand smoke¹ by poverty income level, 1988-2020 Overview Graph Detailed Trend Graphs Most Recent Estimates (2017 to 2020) Percent of nonsmokers 95% Confidence Interval 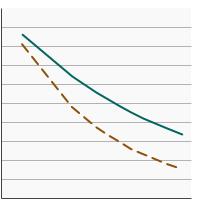
<200% of federal poverty level 37.0 33.5 - 40.5 >=200% of federal poverty level 17.5 14.9 - 20.1 ¹As measured by a serum cotinine level of greater than 0.05 ng/ml and less than or equal to 10 ng/ml. The 2017 to 2020 data point is from the NHANES 2017-March 2020 Pre-pandemic dataset. This includes data from the NHANES 2017-2018 survey combined with data collected for the 2019-2020 NHANES survey before field operations were shut down due to the Covid pandemic. - By Education Level
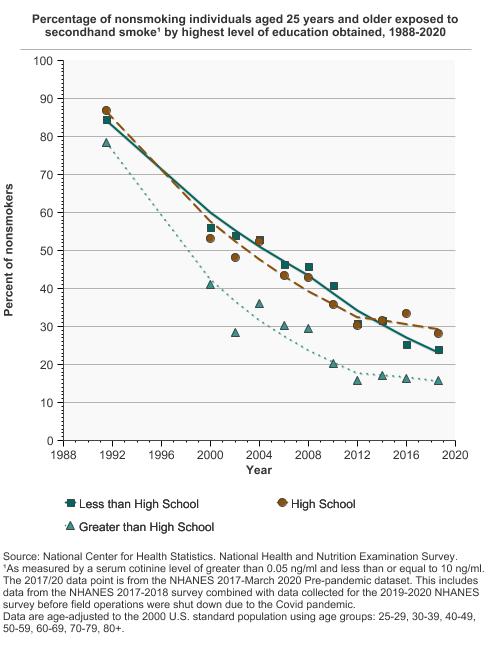
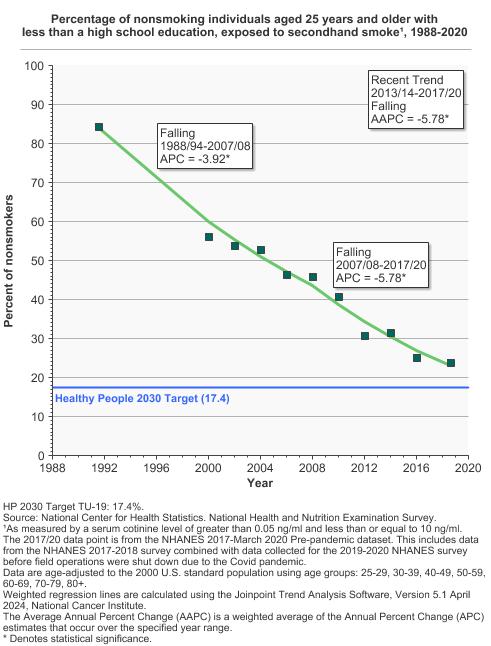
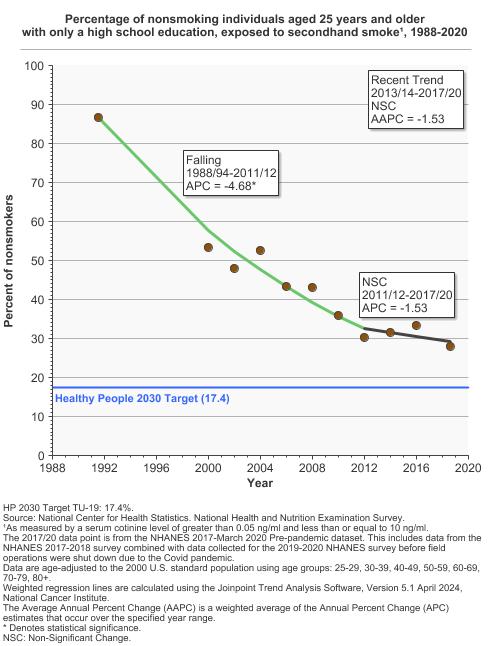
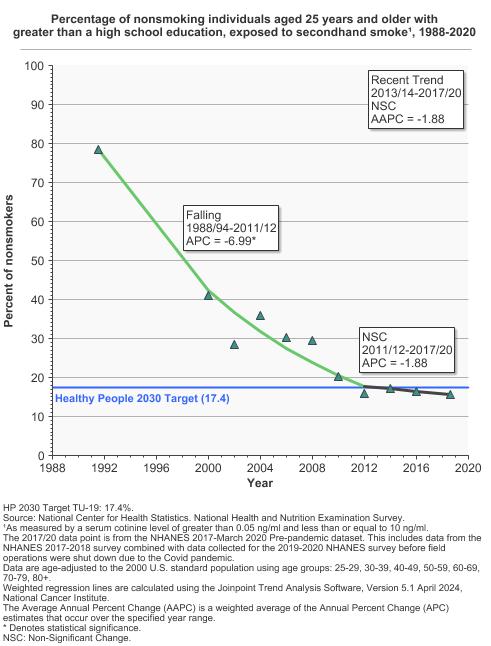
Percentage of nonsmoking individuals aged 25 years and older exposed to secondhand smoke¹ by highest level of education obtained, 1988-2020 Overview Graph Detailed Trend Graphs Most Recent Estimates (2017 to 2020) Percent of nonsmokers 95% Confidence Interval 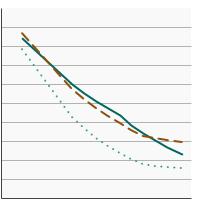
Less than High School 23.9 20.1 - 27.8 High School 28.1 23.5 - 32.6 Greater than High School 15.7 13.7 - 17.7 ¹As measured by a serum cotinine level of greater than 0.05 ng/ml and less than or equal to 10 ng/ml. The 2017 to 2020 data point is from the NHANES 2017-March 2020 Pre-pandemic dataset. This includes data from the NHANES 2017-2018 survey combined with data collected for the 2019-2020 NHANES survey before field operations were shut down due to the Covid pandemic.


Additional Information
- Secondhand Smoke Exposure. National Cancer Institute.
- Secondhand Smoke and Cancer. National Cancer Institute.
- The Dangers of Secondhand Smoke. American Academy of Pediatrics.
- Smoking and Tobacco Use: Secondhand Smoke. Centers for Disease Control and Prevention.
- Secondhand Smoke and Smoke-free Homes. Environmental Protection Agency.
- Secondhand Smoke and What it Means to You. U.S. Department of Health and Human Services.
- Tobacco Control Monograph Series. National Cancer Institute.
- Monograph 10: Health Effects of Exposure to Environmental Tobacco Smoke. National Cancer Institute.
- Tobacco Control Evidence-Based Programs Listing. National Cancer Institute.
- 50 Years of Progress: A Report of the Surgeon General, 2014. U.S. Department of Health and Human Services.
- The Health Consequences of Involuntary Exposure to Tobacco Smoke: A Report of the Surgeon General, 2006. U.S. Department of Health and Human Services.
- Report on Carcinogens. National Toxicology Program, U.S. Department of Health and Human Services.
- Secondhand Smoke Exposure Among Nonsmoking Adults: United States, 2015–2018. Brody DJ, Faust E, Tsai J. NCHS Data Brief 2021;396.
- Secondhand Smoke Exposure and Subsequent Academic Performance Among U.S. Youth. Choi K, Chen-Sankey JC, Merianos AL, McGruder C, Yerger V. Am J Prev Med. 2020;58(6):776-782.
- Exposure to Secondhand Smoke and Secondhand E-Cigarette Aerosol Among Middle and High School Students. Gentzke AS, Wang TW, Marynak KL, Trivers KF, King BA. Prev Chronic Dis. 2019;16:180531.
- Housing type and secondhand tobacco smoke exposure among non-smoking New York City adults, 2004 and 2013–14. Farley SM, Jasek J, Debchoudhury I, Van Becka K, Talatia A, Perlman SF, et al. Preventive Medicine Reports. 2022; 27:101805.
- National and state estimates of secondhand smoke infiltration among U.S. multiunit housing residents. King BA, Babb SD, Tynan MA, Gerzoff RB. Nicotine Tob Res 2013 Jul;15(7):1316-21.
- Effects of Electronic Cigarettes on Indoor Air Quality and Health. Li L, Lin Y, Xia T, Zhu Y. Annu Rev Public Health 2020;41(2):363-380.
- Secondhand Smoke Exposure at Home and/or in a Vehicle: Differences Between Urban and Non-Urban Adolescents in the United States, From 2015 to 2018. Mantey DS, Omega-Njemnobi O, Barroso CS. Nicotine Tob Res. 2021;23(8):1327-1333.
- Exposure to Secondhand Smoke in Homes and Vehicles Among US Youths, United States, 2011-2019. Walton K, Gentzke AS, Murphy-Hoefer R, Kenemer B, Neff LJ. Preventing Chronic Disease 2020;17.
- Tobacco Use Supplement to the Current Population Survey. National Cancer Institute.
- Cancer Facts and Figures. American Cancer Society.
- State Tobacco Activities Tracking and Evaluation System. Centers for Disease Control and Prevention.