On This Page:
- Background
- Measure
- Healthy People 2030 Target
- Data Source
- Trends and Most Recent Estimates
- Related Cancers
- Additional Information
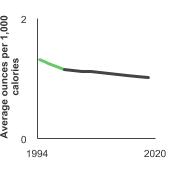
From 2017 to 2020, people aged 2 years and older consumed, on average, 1.0 ounces of red meat per 1,000 calories.

Background
Red meat is associated with an increased risk of colon and rectum cancer, and evidence also suggests it is associated with some other cancers, such as prostate and pancreatic cancer. Examples of red meat include beef, pork, and lamb.
Processed meats are red meat and poultry products that have been preserved by smoking, curing, salting, and/or the addition of chemical preservatives. Examples of processed meat include hot dogs, sausages, bacon, and luncheon meats. Processed meat is associated with an increased risk of colorectal cancer, and evidence also suggests it is associated with stomach cancer. The International Agency for Research on Cancer (IARC) classifies processed meat as a Group 1 carcinogen (meaning it is carcinogenic to humans), and red meat as a Group 2A carcinogen (meaning it is probably carcinogenic to humans).
However, more research is needed to understand how red meat and processed meats influence cancer risk. The increased risk may be explained by the iron and fat content in red meat, and/or the salt and nitrates/nitrites in processed meats. Additionally, when meat is cooked at high temperatures, substances are formed that may cause cancer.
Measure
Average daily ounce equivalents of total red meat (includes processed and unprocessed red meat) and processed red meat and poultry (includes processed red meat and processed poultry) per 1000 calories for people aged 2 years and older.
The Standardized Method for Estimating Intakes of Processed Red Meat and Processed Poultry used to estimate total red meat intake in the U.S. population was automated beginning with NHANES 2007-2008. Organ meats were excluded when the method was automated, based on the definition of red meat in the Dietary Guidelines for Americans. Organ meat intake in the U.S. population is low and therefore did not meaningfully influence total red meat intake estimates when excluded.
Data Source
U.S. Department of Agriculture, Agricultural Research Service, Beltsville Human Nutrition Research Center, Food Surveys Research Group (Beltsville, MD). Continuing Survey of Food Intakes by Individuals 1994-96, 1998.
Centers for Disease Control and Prevention, National Center for Health Statistics, National Health and Nutrition Examination Survey (NHANES).
The NHANES 2017-2018 data point was replaced with the NHANES 2017-March 2020 Pre-pandemic data point. More information is available at NHANES Questionnaires, Datasets, and Related Documentation.
Healthy People 2030 Target
- There is no Healthy People target for red meat and processed meat consumption.
Healthy People 2030 is a set of goals set forth by the Department of Health and Human Services.
Trends and Most Recent Estimates
- Total Red Meat
- By Sex
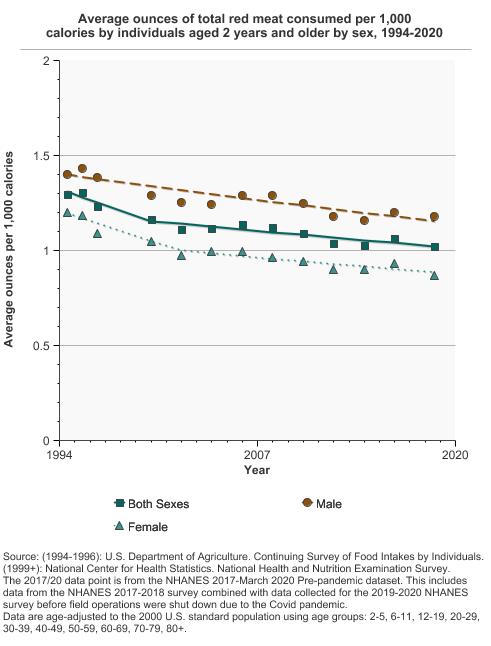
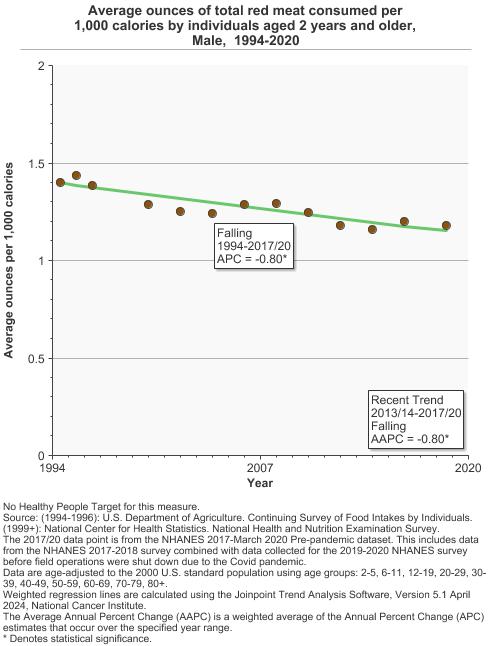
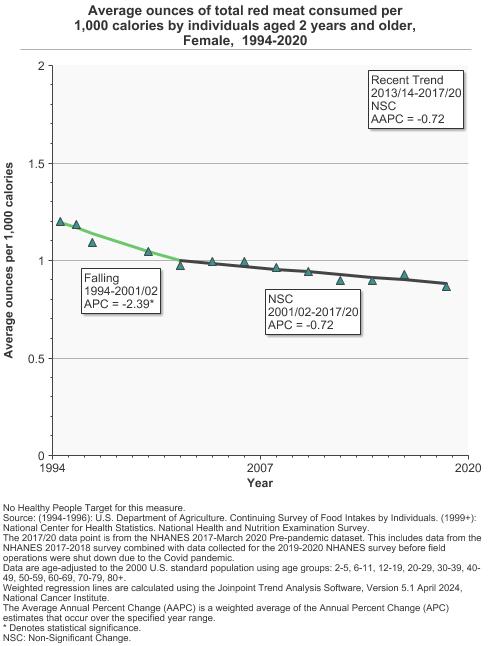
Average ounces of total red meat consumed per 1,000 calories by individuals aged 2 years and older by sex, 1994-2020 Overview Graph Detailed Trend Graphs Most Recent Estimates (2017 to 2020) Average ounces per 1,000 calories 95% Confidence Interval 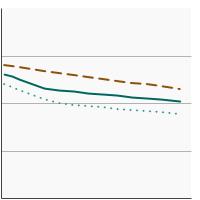

Both Sexes 
1.0 1.0 - 1.1 Male 1.2 1.1 - 1.3 Female 0.9 0.8 - 0.9 The 2017 to 2020 data point is from the NHANES 2017-March 2020 Pre-pandemic dataset. This includes data from the NHANES 2017-2018 survey combined with data collected for the 2019-2020 NHANES survey before field operations were shut down due to the Covid pandemic. - By Race/Ethnicity
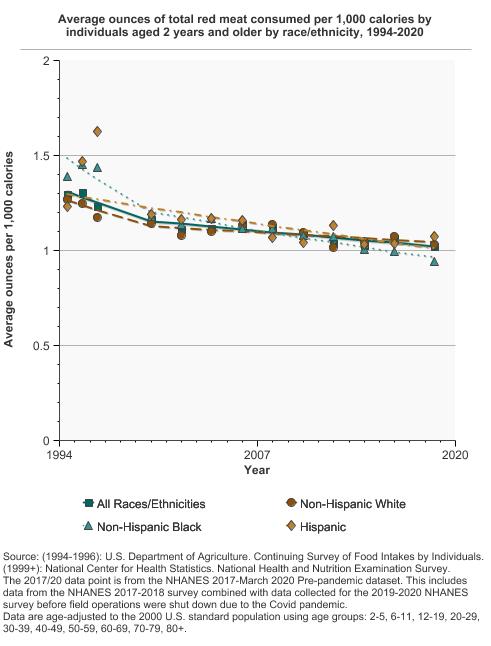
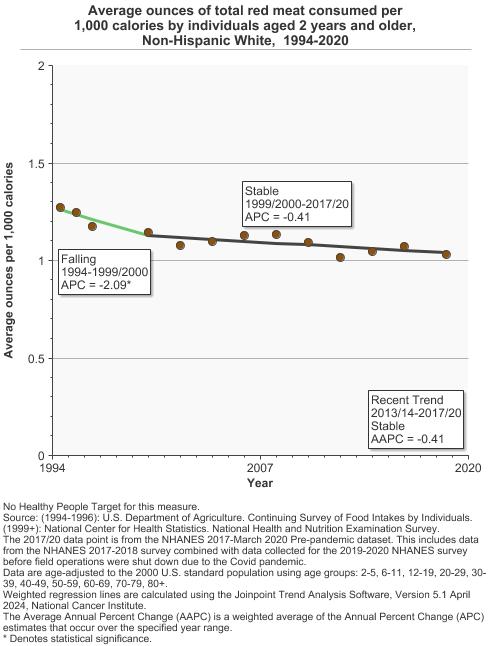
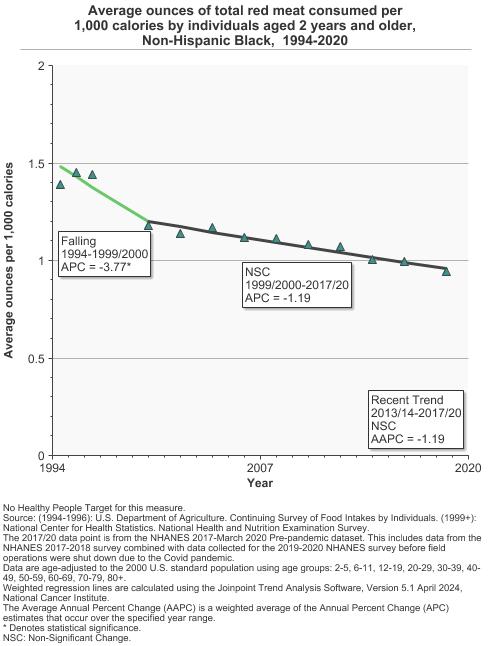
Average ounces of total red meat consumed per 1,000 calories by individuals aged 2 years and older by race/ethnicity, 1994-2020 Overview Graph Detailed Trend Graphs Most Recent Estimates (2017 to 2020) Average ounces per 1,000 calories 95% Confidence Interval 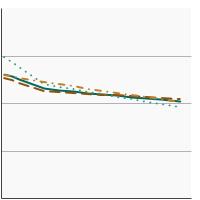
All Races/Ethnicities 1.0 1.0 - 1.1 Non-Hispanic White 1.0 0.9 - 1.1 Non-Hispanic Black 0.9 0.8 - 1.0 Hispanic 1.1 1.0 - 1.2 The 2017 to 2020 data point is from the NHANES 2017-March 2020 Pre-pandemic dataset. This includes data from the NHANES 2017-2018 survey combined with data collected for the 2019-2020 NHANES survey before field operations were shut down due to the Covid pandemic. - By Poverty Income Level
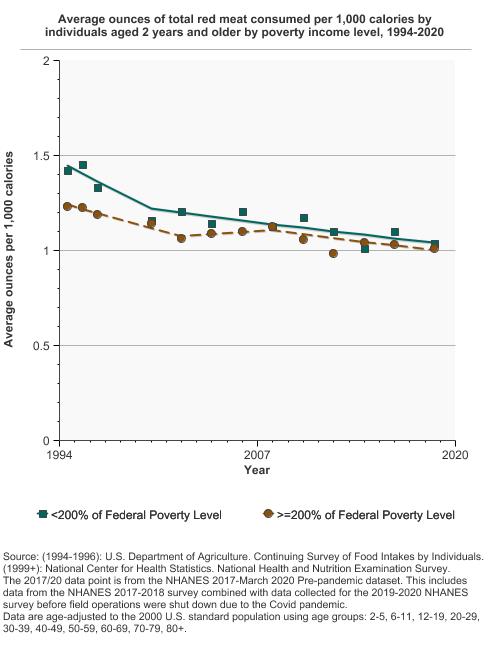
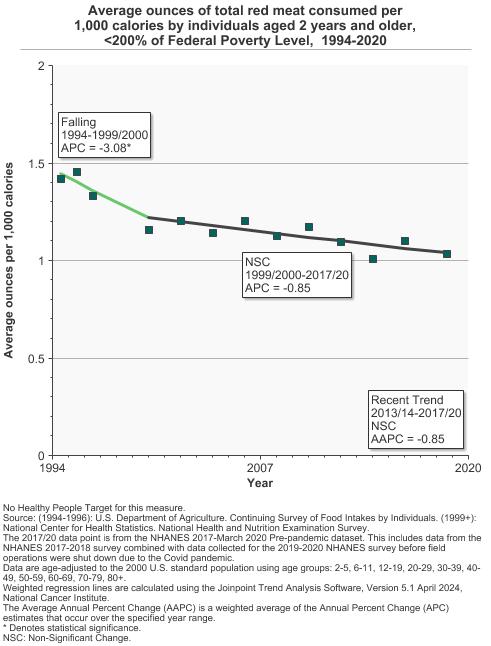
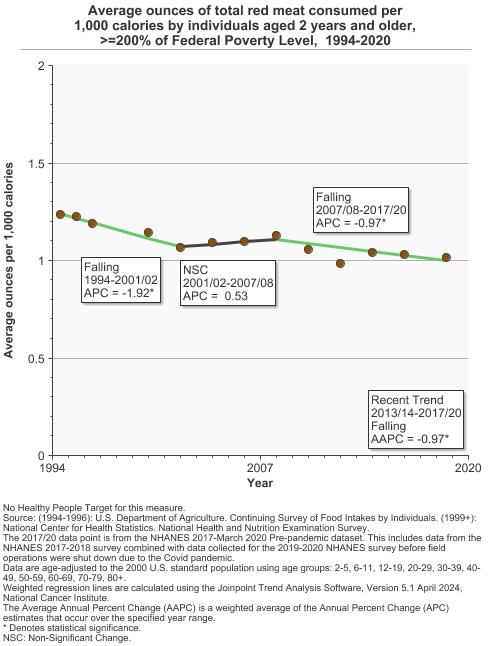
Average ounces of total red meat consumed per 1,000 calories by individuals aged 2 years and older by poverty income level, 1994-2020 Overview Graph Detailed Trend Graphs Most Recent Estimates (2017 to 2020) Average ounces per 1,000 calories 95% Confidence Interval 
<200% of Federal Poverty Level 1.0 0.9 - 1.1 >=200% of Federal Poverty Level 1.0 0.9 - 1.1 The 2017 to 2020 data point is from the NHANES 2017-March 2020 Pre-pandemic dataset. This includes data from the NHANES 2017-2018 survey combined with data collected for the 2019-2020 NHANES survey before field operations were shut down due to the Covid pandemic.
- Processed Red Meat and Poultry
- By Sex
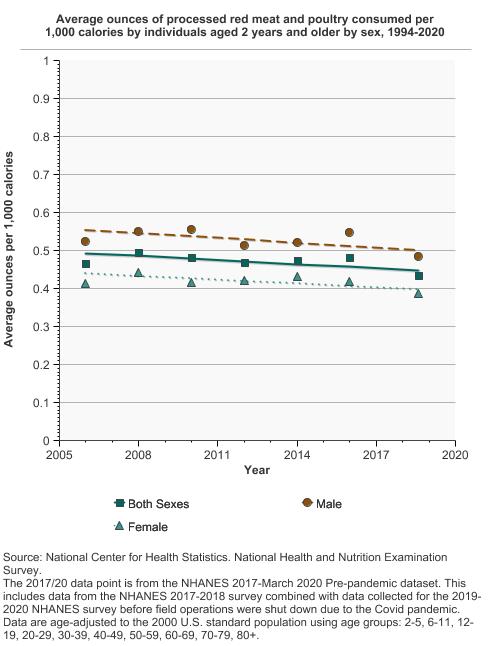
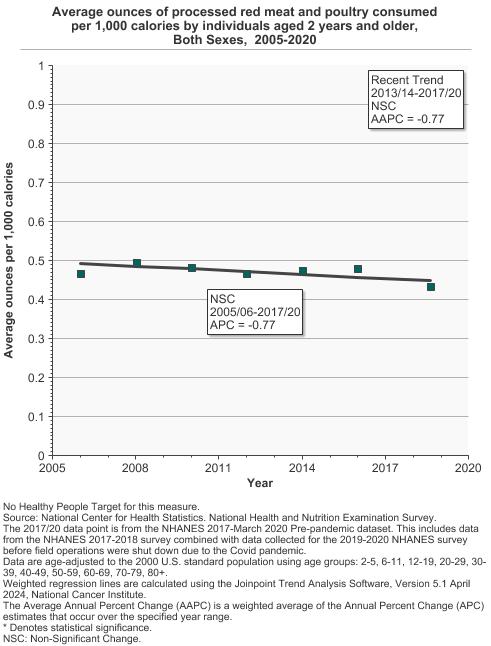
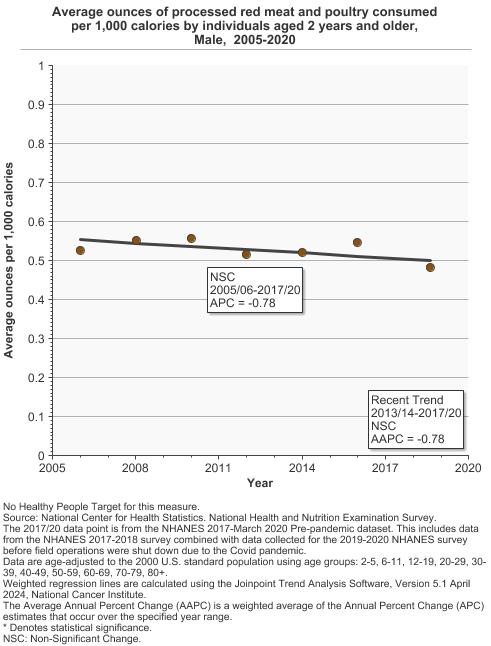
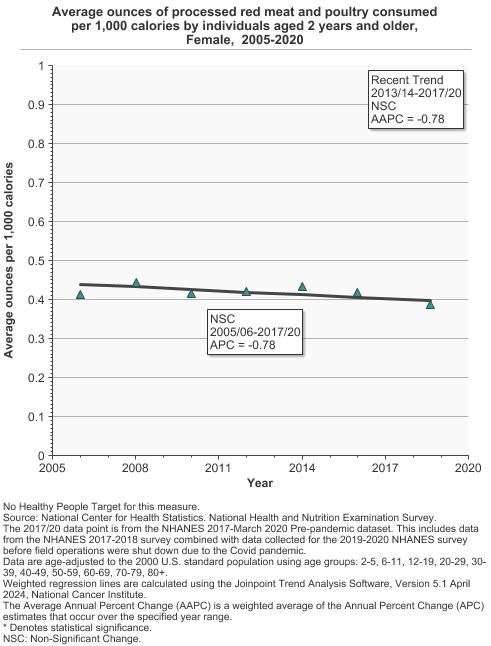
Average ounces of processed red meat and poultry consumed per 1,000 calories by individuals aged 2 years and older by sex, 1994-2020 Overview Graph Detailed Trend Graphs Most Recent Estimates (2017 to 2020) Average ounces per 1,000 calories 95% Confidence Interval 
Both Sexes 0.4 0.4 - 0.5 Male 0.5 0.4 - 0.5 Female 0.4 0.4 - 0.4 The 2017 to 2020 data point is from the NHANES 2017-March 2020 Pre-pandemic dataset. This includes data from the NHANES 2017-2018 survey combined with data collected for the 2019-2020 NHANES survey before field operations were shut down due to the Covid pandemic. - By Race/Ethnicity
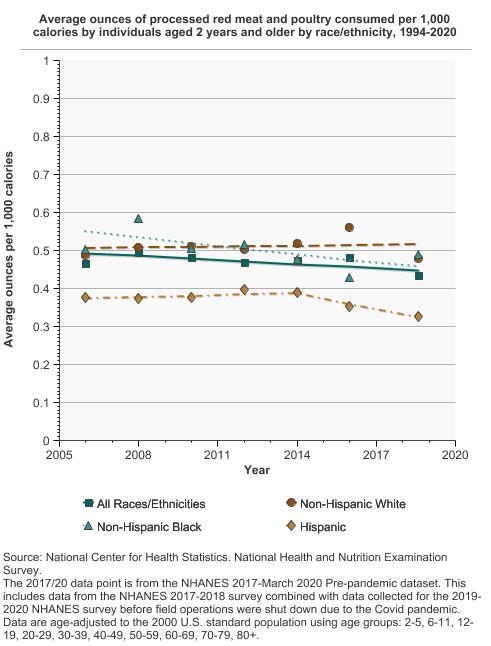
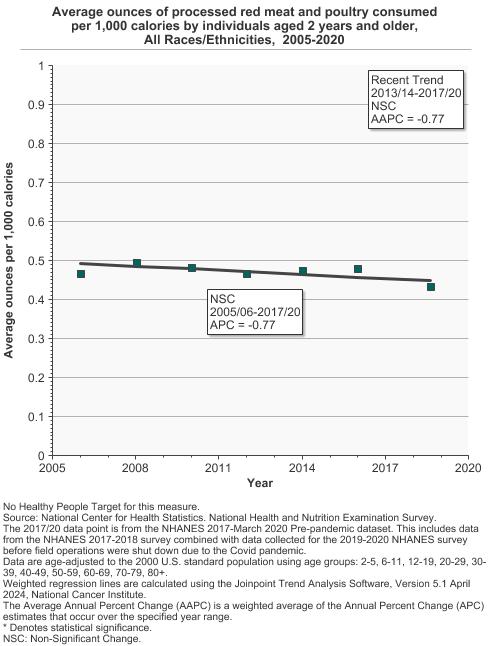
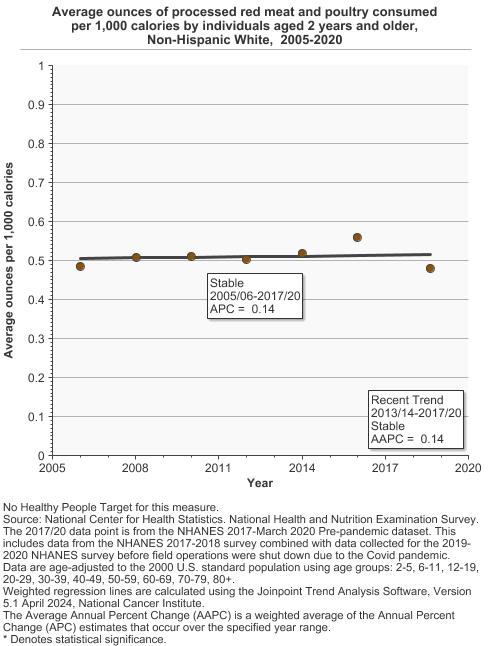
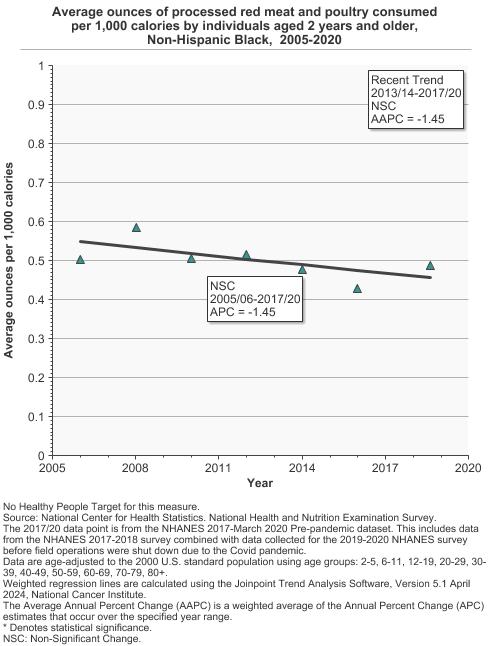
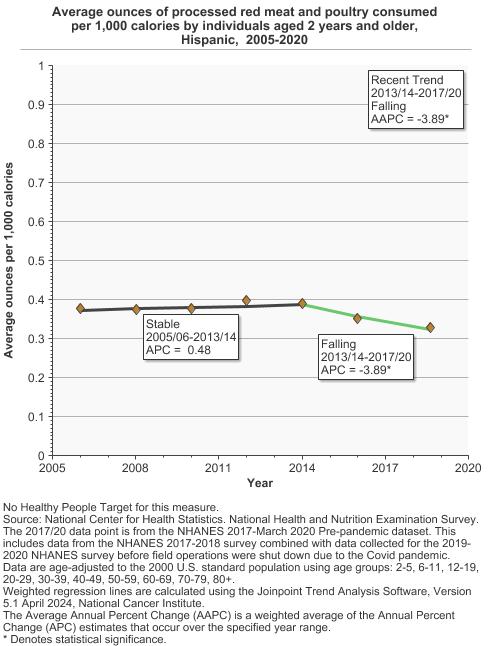
Average ounces of processed red meat and poultry consumed per 1,000 calories by individuals aged 2 years and older by race/ethnicity, 1994-2020 Overview Graph Detailed Trend Graphs Most Recent Estimates (2017 to 2020) Average ounces per 1,000 calories 95% Confidence Interval 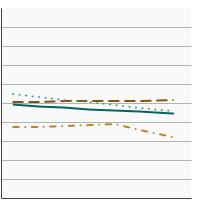
All Races/Ethnicities 0.4 0.4 - 0.5 Non-Hispanic White 0.5 0.4 - 0.5 Non-Hispanic Black 0.5 0.4 - 0.5 Hispanic 0.3 0.3 - 0.4 The 2017 to 2020 data point is from the NHANES 2017-March 2020 Pre-pandemic dataset. This includes data from the NHANES 2017-2018 survey combined with data collected for the 2019-2020 NHANES survey before field operations were shut down due to the Covid pandemic. - By Poverty Income Level
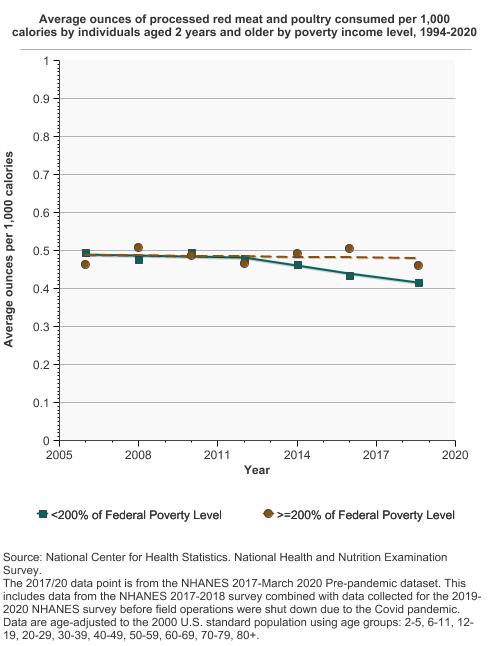
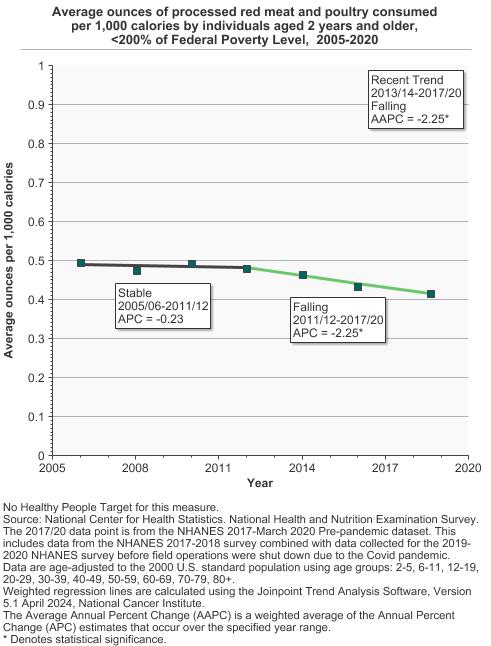
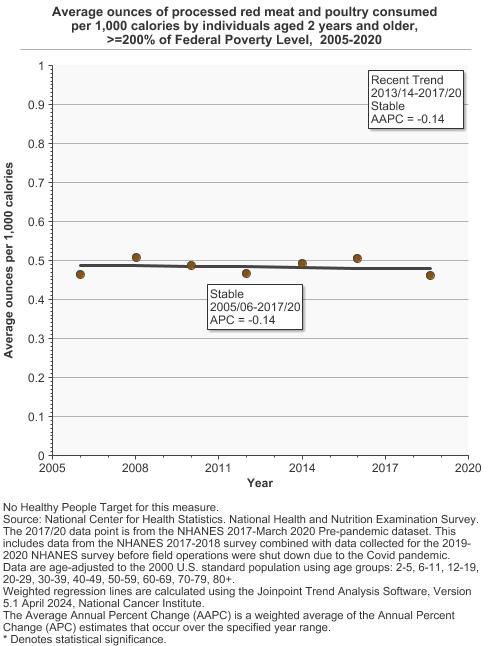
Average ounces of processed red meat and poultry consumed per 1,000 calories by individuals aged 2 years and older by poverty income level, 1994-2020 Overview Graph Detailed Trend Graphs Most Recent Estimates (2017 to 2020) Average ounces per 1,000 calories 95% Confidence Interval 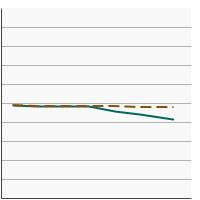
<200% of Federal Poverty Level 0.4 0.4 - 0.5 >=200% of Federal Poverty Level 0.5 0.4 - 0.5 The 2017 to 2020 data point is from the NHANES 2017-March 2020 Pre-pandemic dataset. This includes data from the NHANES 2017-2018 survey combined with data collected for the 2019-2020 NHANES survey before field operations were shut down due to the Covid pandemic.


Additional Information
- Chemicals in Meat Cooked at High Temperatures and Cancer Risk. National Cancer Institute.
- ACS Guideline on Nutrition and Physical Activity for Cancer Prevention. American Cancer Society.
- Diet and Physical Activity: What’s the Cancer Connection? American Cancer Society.
- Cancer Prevention and Control: Healthy Choices. Centers for Disease Control and Prevention.
- Cancer: Carcinogenicity of the consumption of red meat and processed meat. World Health Organization.
- Diet/Nutrition Evidence-Based Programs Listing. National Cancer Institute.
- 2020-2025 Dietary Guidelines for Americans. U.S. Department of Agriculture and U.S. Department of Health and Human Services.
- Global Cancer Update Programme. World Cancer Research Fund International.
- Diet, Nutrition, Physical Activity, and Cancer: a Global Perspective. World Cancer Research Fund and the American Institute for Cancer Research.
- Diet, nutrition and the prevention of chronic diseases. World Health Organization.
- A large prospective study of meat consumption and colorectal cancer risk: an investigation of potential mechanisms underlying this association. Cross AJ, Ferrucci LM, Risch A. Cancer Res 2010;70:2406.
- American Cancer Society guideline for diet and physical activity for cancer prevention. Rock CL, Thomson C, Gansler T, et al. CA Cancer J Clin. 2020; 70(4): 245-271.
- Carcinogenicity of Consumption of Red and Processed Meat. Bouvard V, Loomis D, Guyton KZ, et al. Carcinogenicity of consumption of red and processed meat. Lancet Oncol. 2015;16(16):1599-1600.
- Usual Dietary Intakes: Food Intakes, U.S. Population, 2007–10. National Cancer Institute.
- What We Eat in America. U.S. Department of Agriculture.