On This Page:
- Background
- Measure
- Healthy People 2030 Target
- Data Source
- Trends and Most Recent Estimates
- Related Cancers
- Additional Information
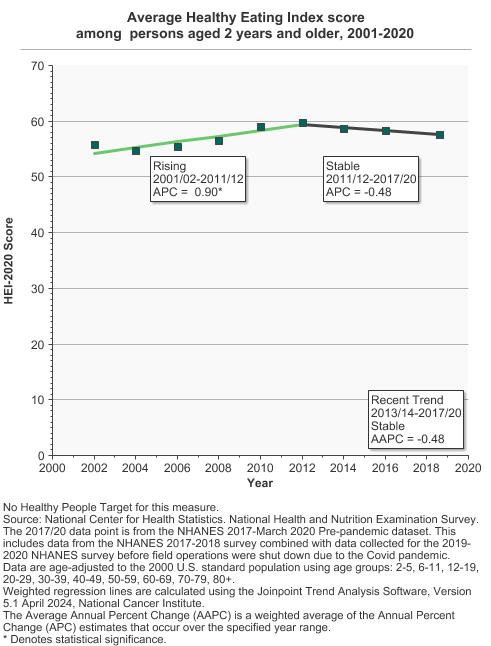
From 2017 to 2020, people aged 2 years and older scored 57.6 on the Healthy Eating Index score range of 0 - 100.
Background
Poor diet quality is associated with an increased risk of cancer. Measuring total diet quality is complex, so some analyses have focused only on individual dietary constituents. However, such a reductionist approach may provide limited information, so a more integrated approach that captures the total diet, or dietary pattern, is useful. The Healthy Eating Index (HEI) is a measure of overall diet quality, independent of diet quantity, that measures alignment with the Dietary Guidelines for Americans.
Measure
The HEI is a measure of overall diet quality, independent of quantity, that can be used to assess alignment with the most current Dietary Guidelines for Americans. Through a collaboration with NCI and USDA, the HEI is revised and updated every five years to reflect updates in dietary guidance. The HEI is a scoring metric that has been used widely in surveillance, epidemiologic, and intervention research to study diet quality among populations, the associations between diet quality and health outcomes, and the impact of interventions on diet quality, as well as in economic and food environment-based research.
Here, the HEI is applied to nationally representative data from the National Health and Nutrition Examination Survey (NHANES) to estimate a total HEI score on a scale from 0 to 100 points. The total HEI score is made up of 13 components, each of which reflects an important aspect of diet quality. Nine components focus on adequacy (foods we should eat enough of to get the nutrients we need and for overall good health). Four components focus on moderation (dietary components that should be limited or consumed in small amounts). View more information about the HEI.
Data Source
Centers for Disease Control and Prevention, National Center for Health Statistics, National Health and Nutrition Examination Survey (NHANES).
The NHANES 2017-2018 data point was replaced with the NHANES 2017-March 2020 Pre-pandemic data point. More information is available at NHANES Questionnaires, Datasets, and Related Documentation.
Healthy People 2030 Target
- There is no Healthy People target for the Healthy Eating Index.
Healthy People 2030 is a set of goals set forth by the Department of Health and Human Services.
Trends and Most Recent Estimates
- By Sex
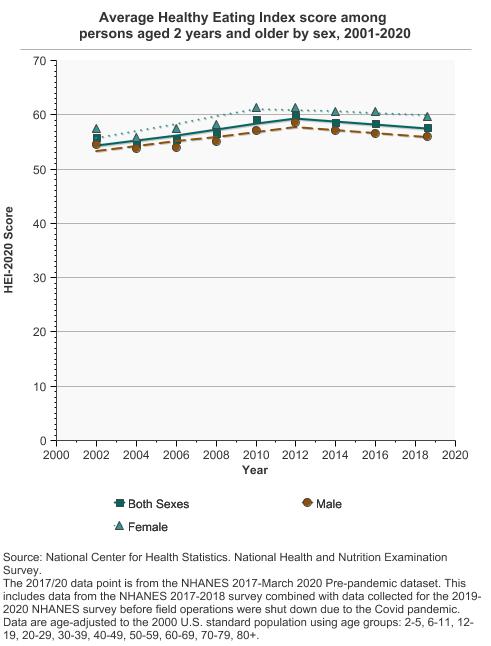
Average Healthy Eating Index score among persons aged 2 years and older by sex, 2001-2020 Overview Graph Detailed Trend Graphs Most Recent Estimates (2017 to 2020) HEI-2020 Score 95% Confidence Interval 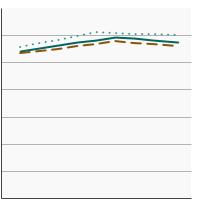

Both Sexes 
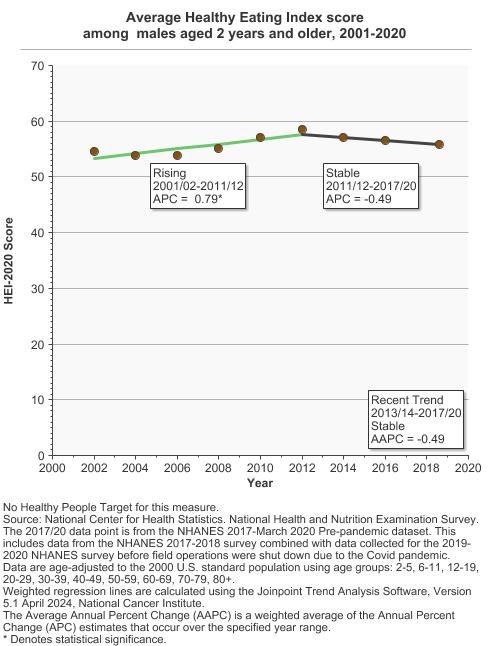
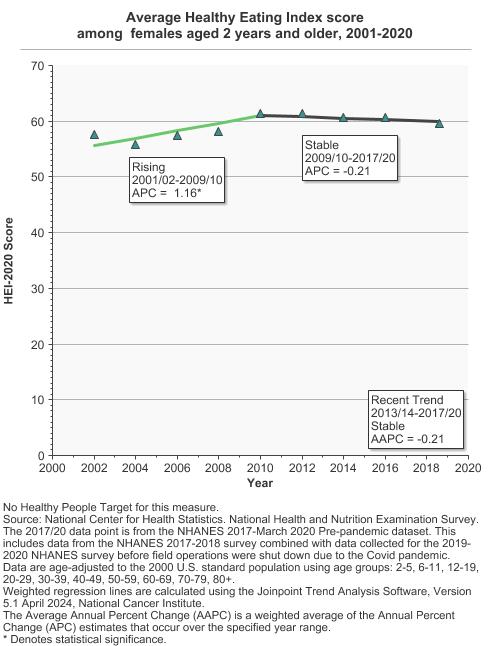
57.6 56.3 - 58.9 Male 55.9 54.6 - 57.2 Female 59.7 58.2 - 61.1 The 2017 to 2020 data point is from the NHANES 2017-March 2020 Pre-pandemic dataset. This includes data from the NHANES 2017-2018 survey combined with data collected for the 2019-2020 NHANES survey before field operations were shut down due to the Covid pandemic. - By Race/Ethnicity
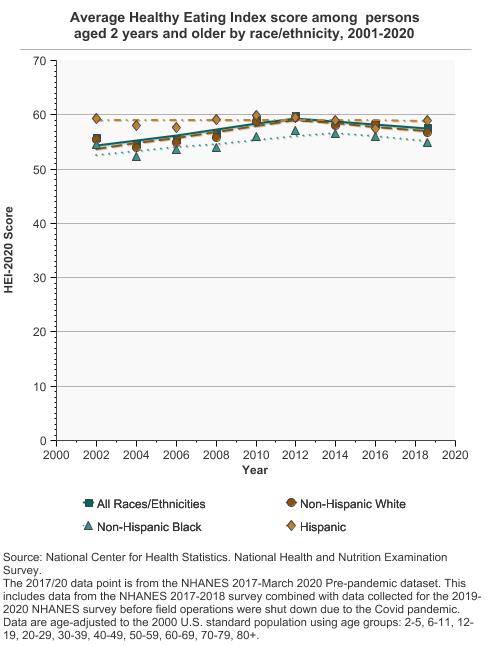
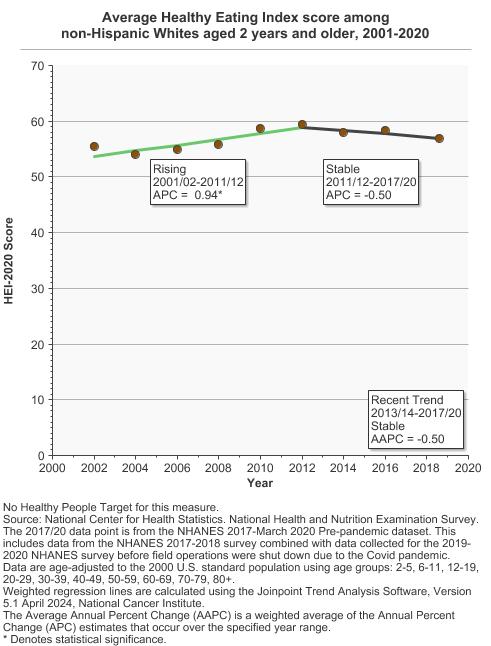
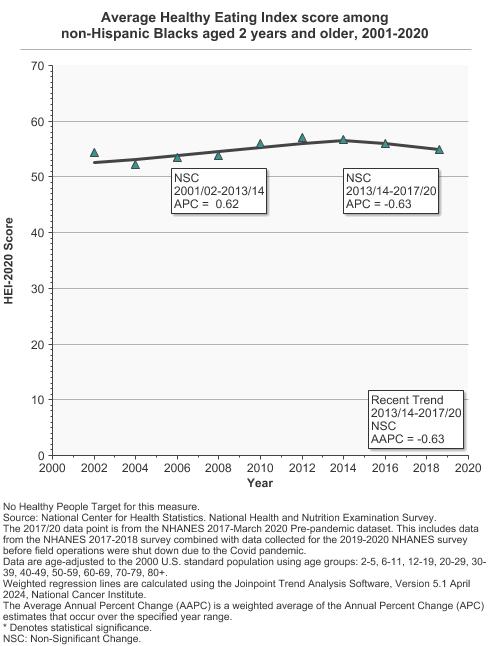
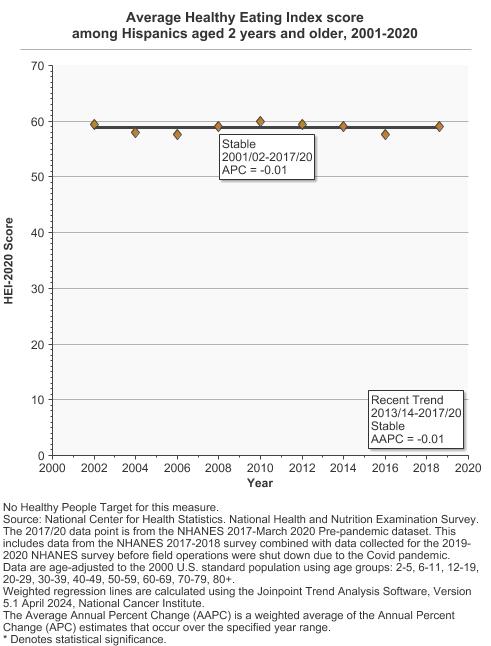
Average Healthy Eating Index score among persons aged 2 years and older by race/ethnicity, 2001-2020 Overview Graph Detailed Trend Graphs Most Recent Estimates (2017 to 2020) HEI-2020 Score 95% Confidence Interval 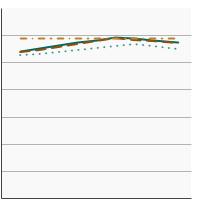
All Races/Ethnicities 57.6 56.3 - 58.9 Non-Hispanic White 56.8 54.9 - 58.8 Non-Hispanic Black 55.0 53.1 - 56.8 Hispanic 59.0 57.2 - 60.6 The 2017 to 2020 data point is from the NHANES 2017-March 2020 Pre-pandemic dataset. This includes data from the NHANES 2017-2018 survey combined with data collected for the 2019-2020 NHANES survey before field operations were shut down due to the Covid pandemic. - By Poverty Income Level
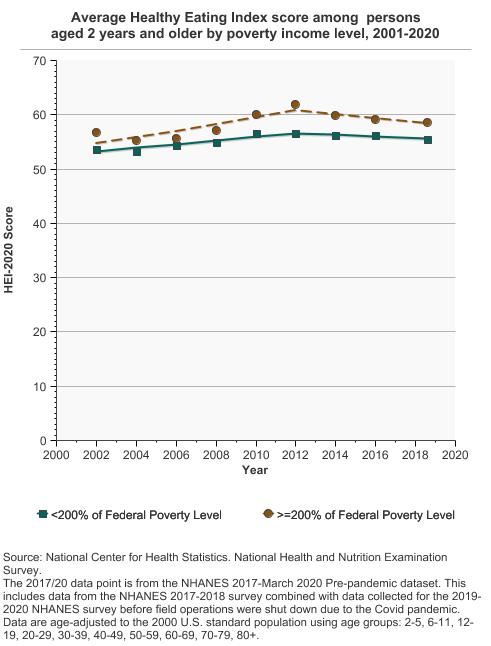
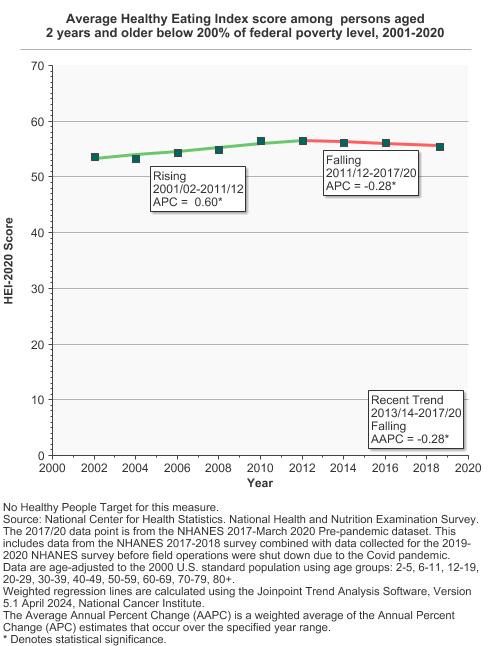
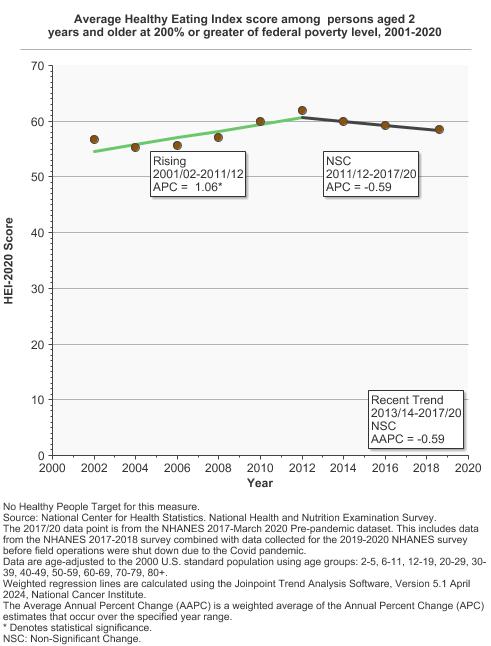
Average Healthy Eating Index score among persons aged 2 years and older by poverty income level, 2001-2020 Overview Graph Detailed Trend Graphs Most Recent Estimates (2017 to 2020) HEI-2020 Score 95% Confidence Interval 
<200% of Federal Poverty Level 55.4 53.6 - 57.2 >=200% of Federal Poverty Level 58.5 57.0 - 60.0 The 2017 to 2020 data point is from the NHANES 2017-March 2020 Pre-pandemic dataset. This includes data from the NHANES 2017-2018 survey combined with data collected for the 2019-2020 NHANES survey before field operations were shut down due to the Covid pandemic.

Additional Information
- ACS Guideline on Nutrition and Physical Activity for Cancer Prevention. American Cancer Society.
- Diet and Physical Activity: What’s the Cancer Connection? American Cancer Society.
- Cancer Prevention and Control: Healthy Choices. Centers for Disease Control and Prevention.
- Healthy Eating Index. U.S. Department of Agriculture.
- Healthy Eating Index. National Collaborative on Childhood Obesity Research.
- Diet/Nutrition Evidence-Based Programs Listing. National Cancer Institute.
- Overview & Background of the Healthy Eating Index. National Cancer Institute.
- Nutrition, Physical Activity, and Obesity. Centers for Disease Control and Prevention.
- 2020-2025 Dietary Guidelines for Americans. U.S. Department of Agriculture and U.S. Department of Health and Human Services.
- Global Cancer Update Programme. World Cancer Research Fund International.
- Diet, Nutrition, Physical Activity, and Cancer: a Global Perspective. World Cancer Research Fund and the American Institute for Cancer Research.
- American Cancer Society guideline for diet and physical activity for cancer prevention. Rock CL, Thomson C, Gansler T, et al. CA Cancer J Clin. 2020; 70(4): 245-271.
- Usual Dietary Intakes: Food Intakes, U.S. Population, 2007–10. National Cancer Institute.
- What We Eat in America. U.S. Department of Agriculture.