On This Page:
- Background
- Measure
- Healthy People 2030 Target
- Data Source
- Trends and Most Recent Estimates
- Additional Information
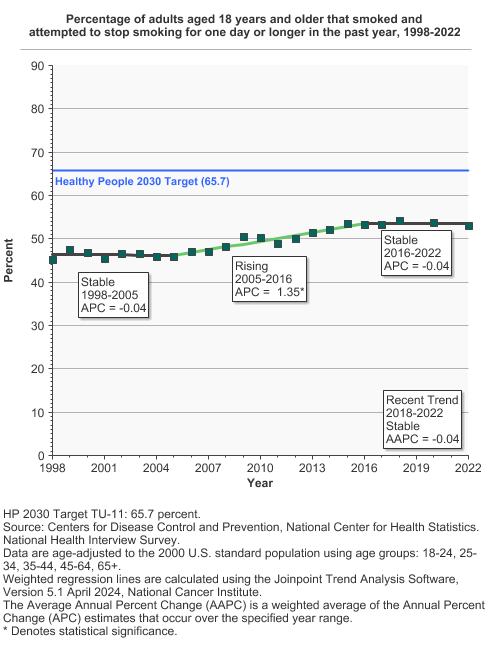
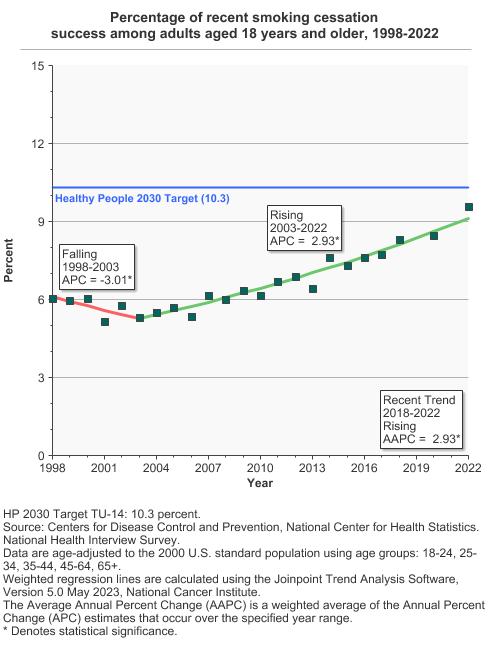
In 2022, 53.0% of adults who smoked attempted to quit smoking within the past year.
Background
Quitting smoking has major and immediate health benefits for people of all ages. Quitting smoking dramatically reduces the risk of lung and other cancers caused by smoking, coronary heart disease, stroke, and chronic obstructive pulmonary disease (COPD). For example, 10-15 years after quitting, the risk of lung cancer decreases to about one-half that of a person who continues to smoke; with continued abstinence from smoking, the risk of lung cancer decreases even further.
Although quitting smoking is beneficial at any age, the earlier in life a person quits, the more likely it is that they will avoid the devastating health effects of continued tobacco use. Few people who smoke quit successfully on their first attempt; most will require many attempts before they are able to permanently quit. This emphasizes the need for those who smoke to begin trying to quit as early in life as possible.
A number of strategies can increase the likelihood of successful smoking cessation. For example, comprehensive, barrier-free, and widely promoted access to insurance coverage for smoking cessation treatment increases treatment use and successful cessation. Treatments that support successful cessation include FDA approved smoking cessation medications and behavioral counseling; the combination of medication and counseling is especially effective. Behavioral counseling and support can be delivered using individual or group counseling, or by quitlines, web and internet, or text-messaging platforms. Cessation rates can also be improved by adopting population-level policies, such as tobacco product price increases, comprehensive smokefree policies, implementing anti-tobacco mass media campaigns, requiring pictorial health warnings on tobacco products, and maintaining comprehensive statewide tobacco control programs.
Measure
Attempt to quit: The percentage of adults (aged 18 years and older) who attempted to quit smoking within the past 12 months. The numerator of this measure includes both people who currently smoke every day or some days and who, at the time of the survey, had quit smoking for at least 1 day during the past 12 months, as well as people who quit smoking less than or equal to 1 year ago. The denominator of this measure includes all adults who smoked 12 months prior to the survey.
Successful quitting: The percentage of adults (aged 18 years and older) who smoke and successfully quit smoking in the past 12 months. The numerator of this measure includes adults who quit smoking 6-12 months prior to the survey. The denominator of this measure includes adults who:
- Formerly smoked and had quit smoking 6-12 months prior to the survey.
- Formerly smoked and had quit smoking less than 6 months prior to the survey.
- Currently smoked at the time of the survey and who initiated smoking at least 2 years prior to the survey.
Data Source
Centers for Disease Control and Prevention, National Center for Health Statistics, National Health Interview Survey 1998-2022.
Refer to the Data Sources page for more information about data collection years 2019+.
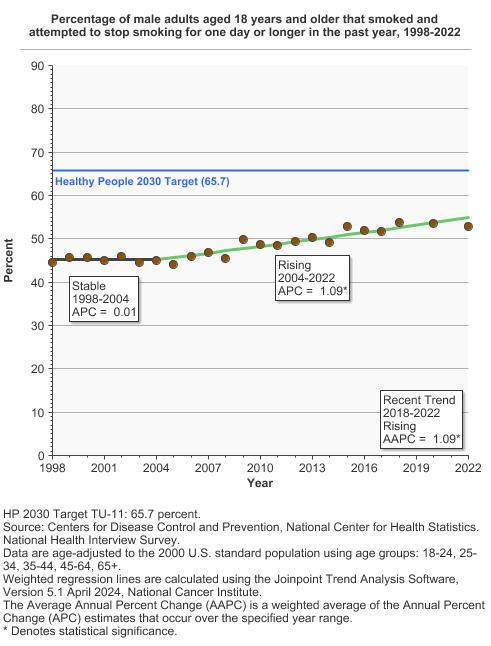
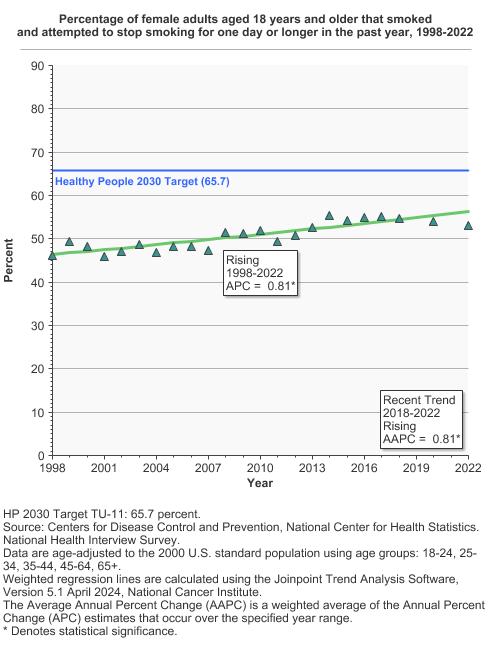
Healthy People 2030 Target
- Increase to 65.7 percent the proportion of adults who currently smoked (aged 18 years and older) who stopped smoking for a day or longer because they were trying to quit in the past 12 months.
- Increase to 10.6 percent the proportion of adults who smoked (aged 18 years and older) who successfully quit smoking in the past 12 months.
Healthy People 2030 is a set of goals set forth by the Department of Health and Human Services.
Note: Goals are indicated as blue line on Detailed Trend Graphs.
Trends and Most Recent Estimates
- Attempted to Quit Smoking
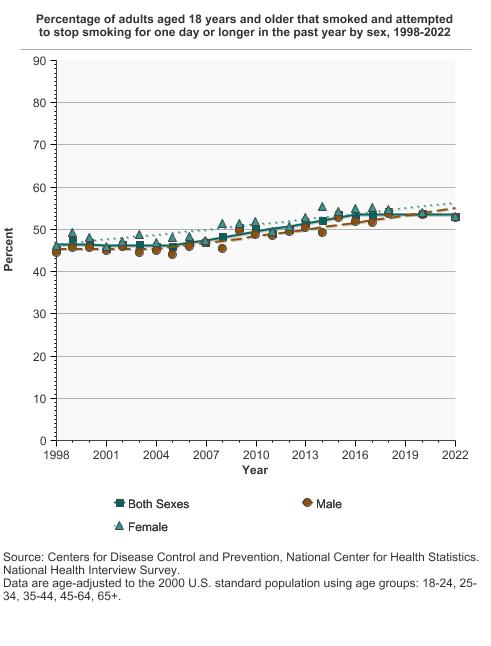
- By Sex
Percentage of adults aged 18 years and older that smoked and attempted to stop smoking for one day or longer in the past year by sex, 1998-2022 Overview Graph Detailed Trend Graphs Most Recent Estimates (2022) Percent 95% Confidence Interval 

Both Sexes 
53.0 50.9 - 55.2 Male 52.9 50.1 - 55.6 Female 53.1 49.4 - 56.8 - By Race/Ethnicity
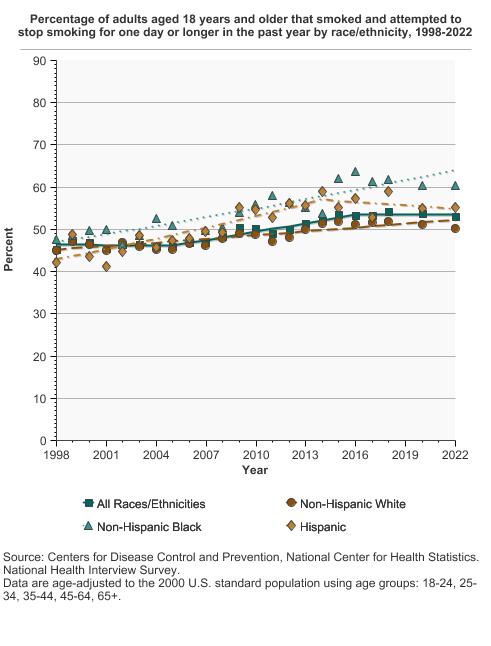
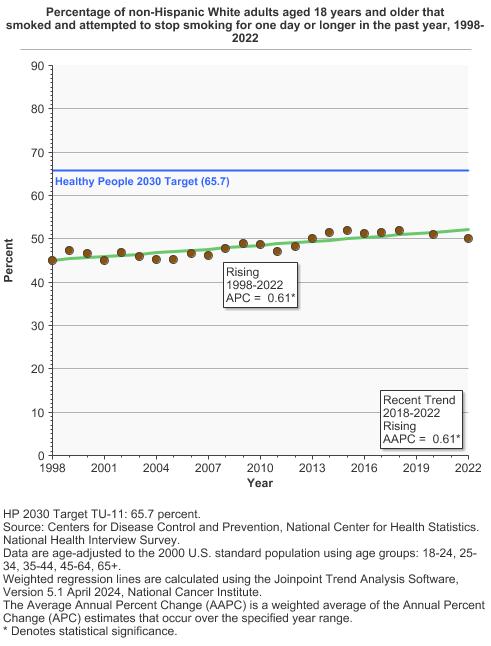
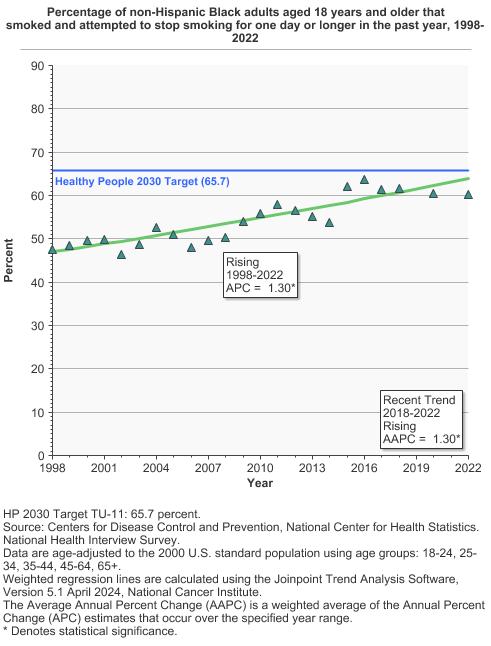
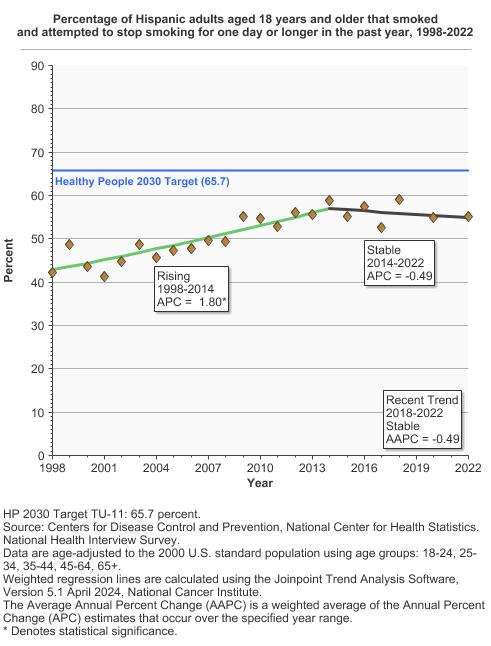
Percentage of adults aged 18 years and older that smoked and attempted to stop smoking for one day or longer in the past year by race/ethnicity, 1998-2022 Overview Graph Detailed Trend Graphs Most Recent Estimates (2022) Percent 95% Confidence Interval 
All Races/Ethnicities 53.0 50.9 - 55.2 Non-Hispanic White 50.2 47.6 - 52.8 Non-Hispanic Black 60.3 55.0 - 65.3 Hispanic 55.2 49.4 - 60.8 - By Age
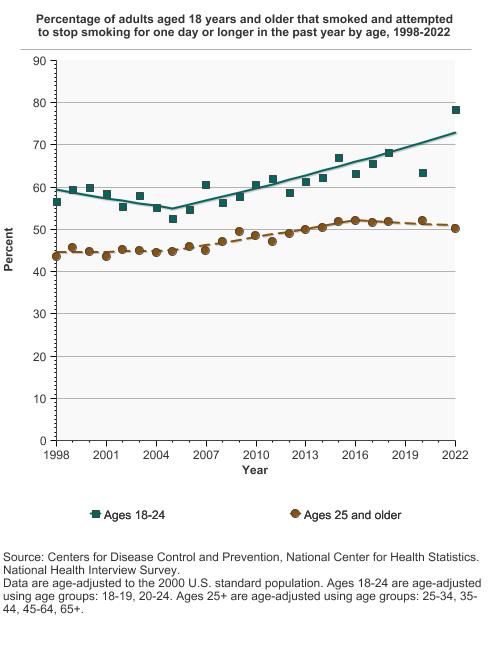
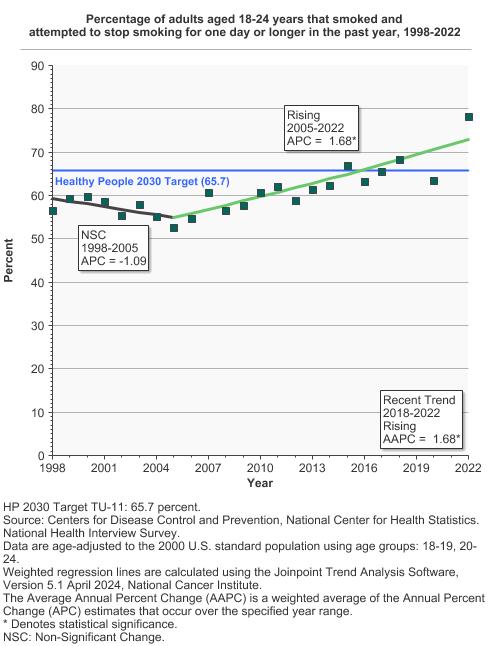
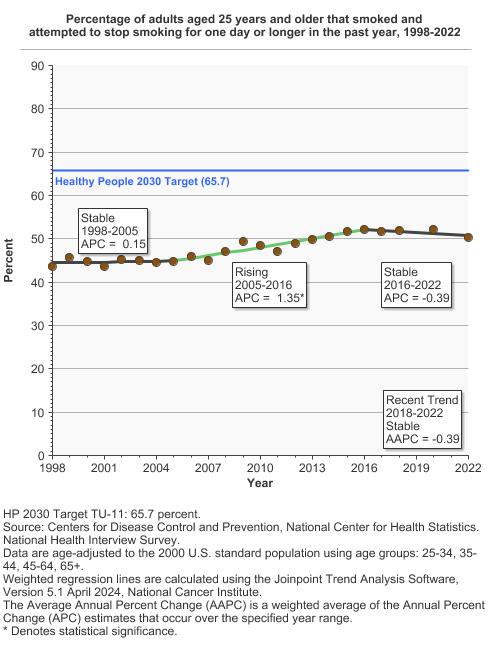
Percentage of adults aged 18 years and older that smoked and attempted to stop smoking for one day or longer in the past year by age, 1998-2022 Overview Graph Detailed Trend Graphs Most Recent Estimates (2022) Percent 95% Confidence Interval 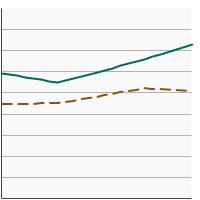
Ages 18-24 78.3 69.8 - 84.9 Ages 25 and older 50.2 48.3 - 52.2 - By Poverty Income Level
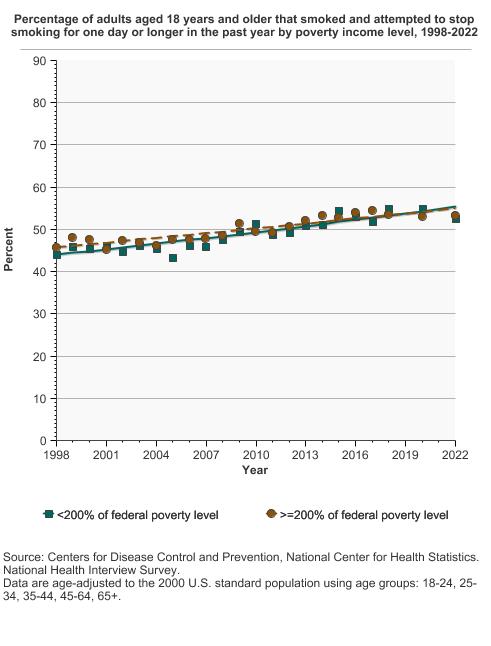
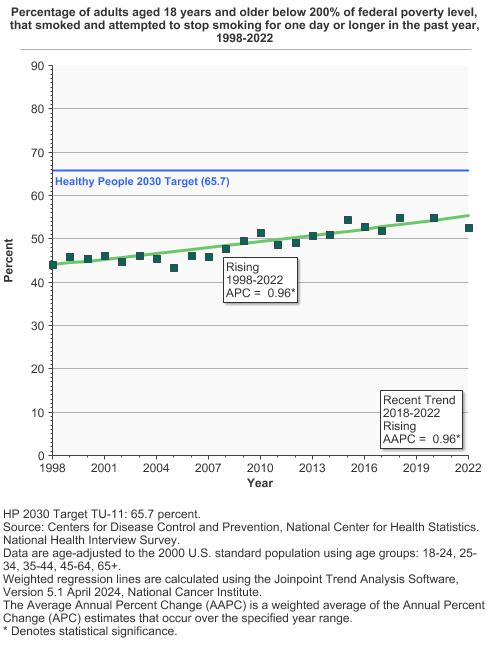
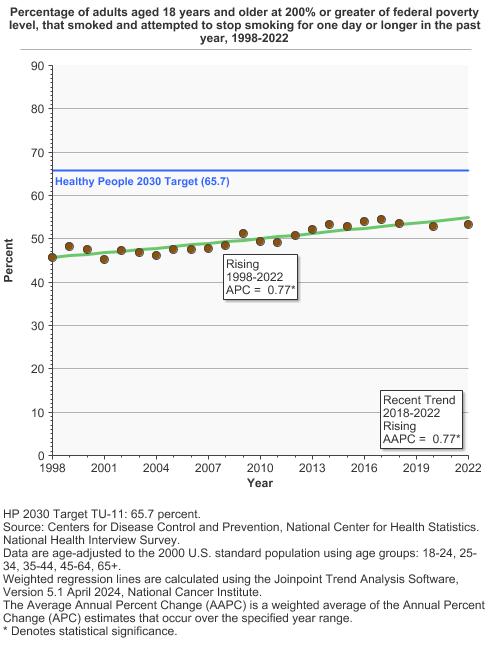
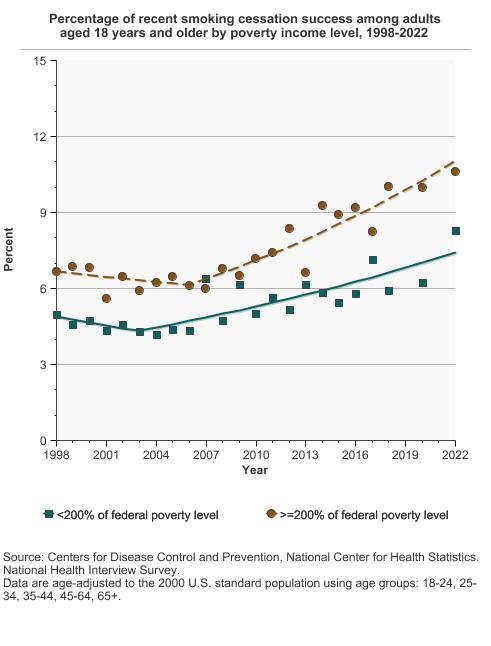
Percentage of adults aged 18 years and older that smoked and attempted to stop smoking for one day or longer in the past year by poverty income level, 1998-2022 Overview Graph Detailed Trend Graphs Most Recent Estimates (2022) Percent 95% Confidence Interval 
<200% of federal poverty level 52.7 49.3 - 56.0 >=200% of federal poverty level 53.4 50.4 - 56.3 - By Education Level
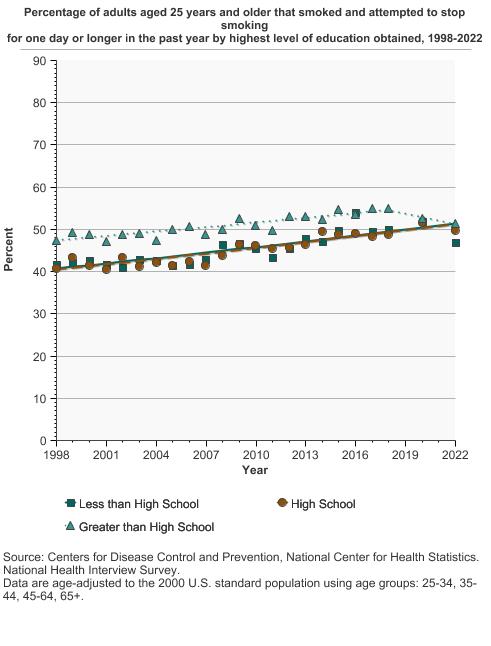
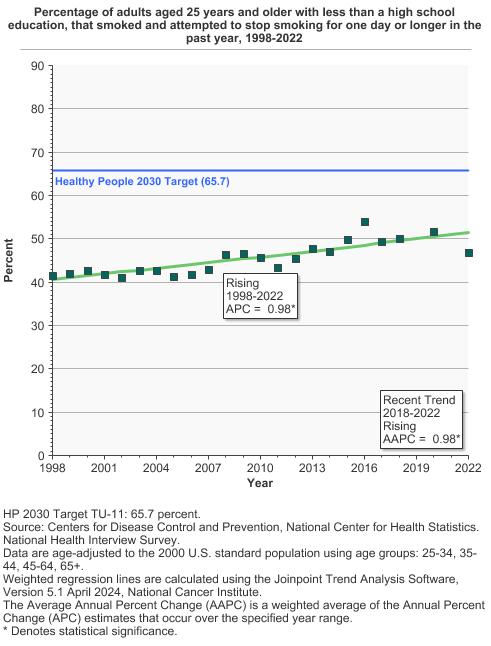
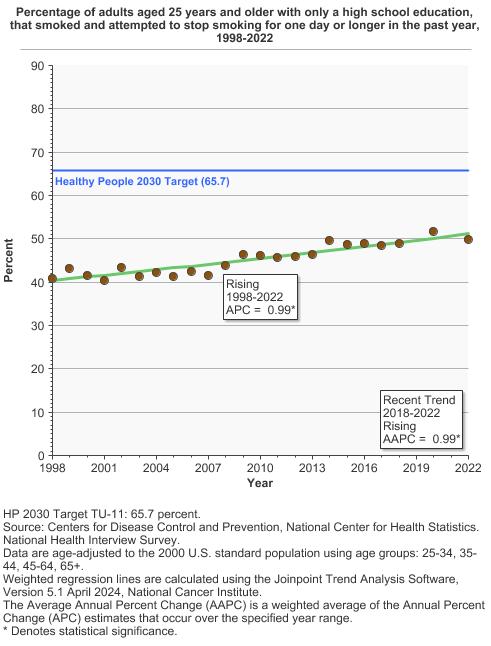
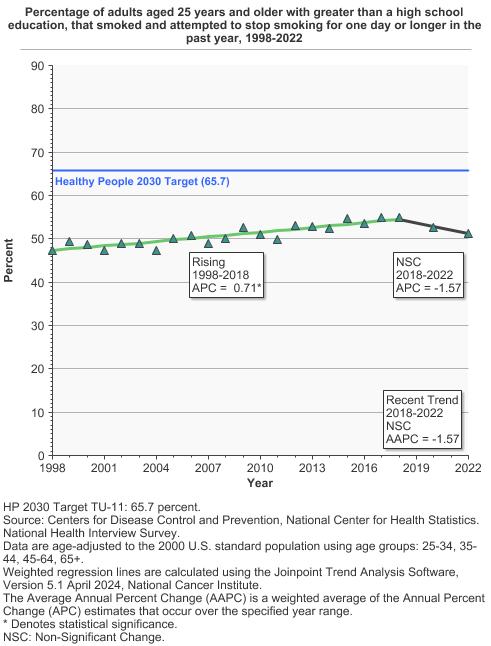
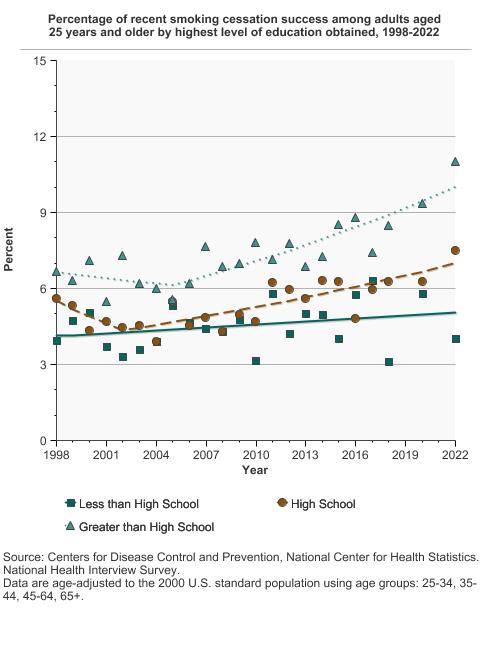
Percentage of adults aged 25 years and older that smoked and attempted to stop smoking for one day or longer in the past year by highest level of education obtained, 1998-2022 Overview Graph Detailed Trend Graphs Most Recent Estimates (2022) Percent 95% Confidence Interval 
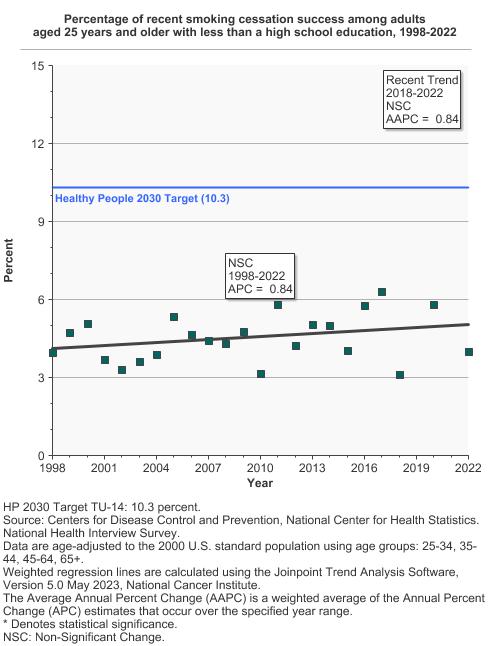
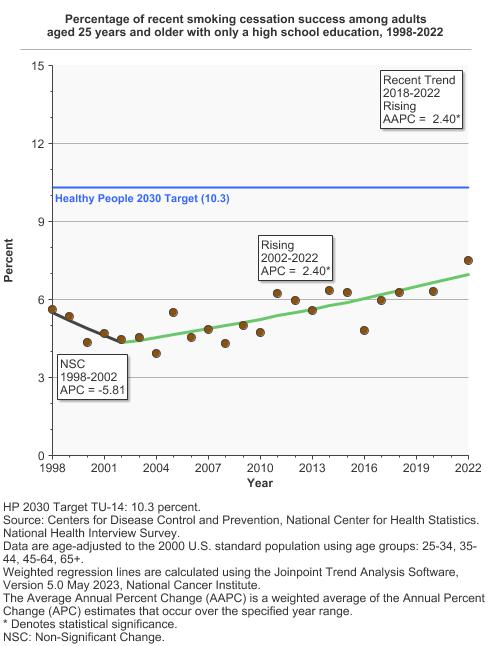
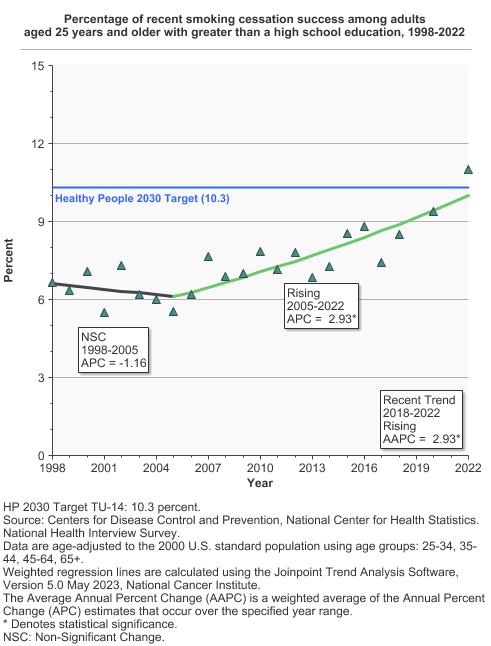
Less than High School 46.8 41.5 - 52.3 High School 49.8 46.6 - 53.0 Greater than High School 51.3 48.4 - 54.2
- Successfully Quit Smoking
- By Sex
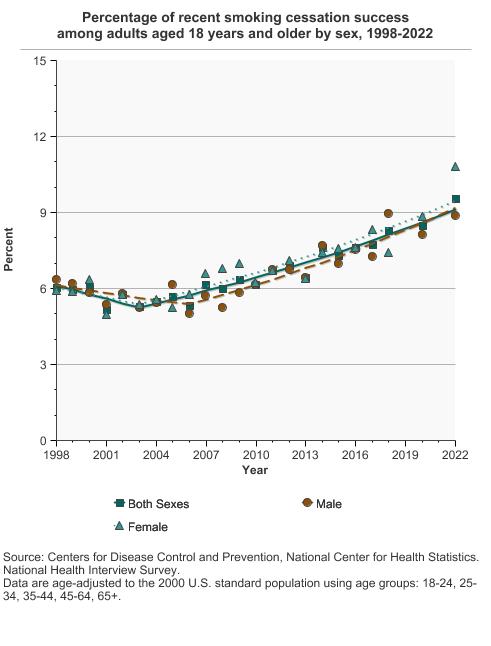
Percentage of recent smoking cessation success among adults aged 18 years and older by sex, 1998-2022 Overview Graph Detailed Trend Graphs Most Recent Estimates (2022) Percent 95% Confidence Interval 
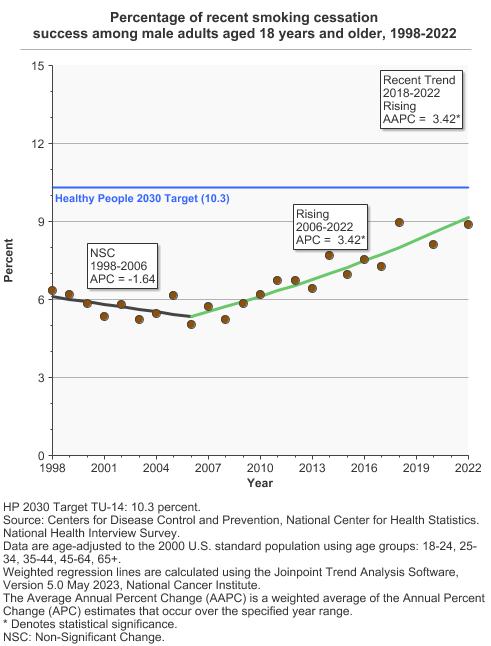
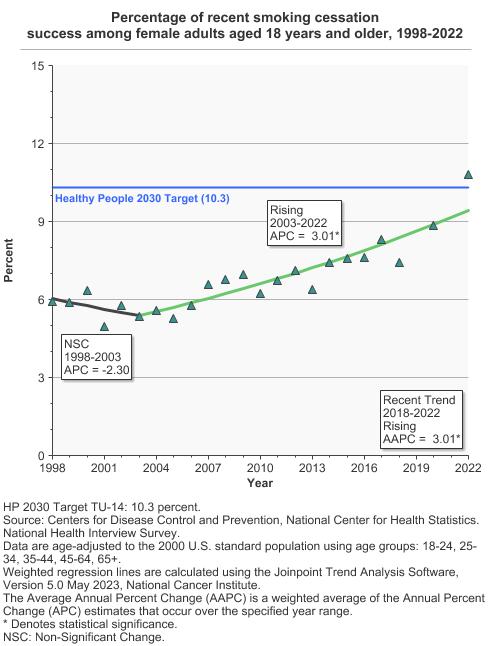
Both Sexes 9.6 8.4 - 10.9 Male 8.9 7.4 - 10.7 Female 10.8 8.9 - 13.1 - By Race/Ethnicity
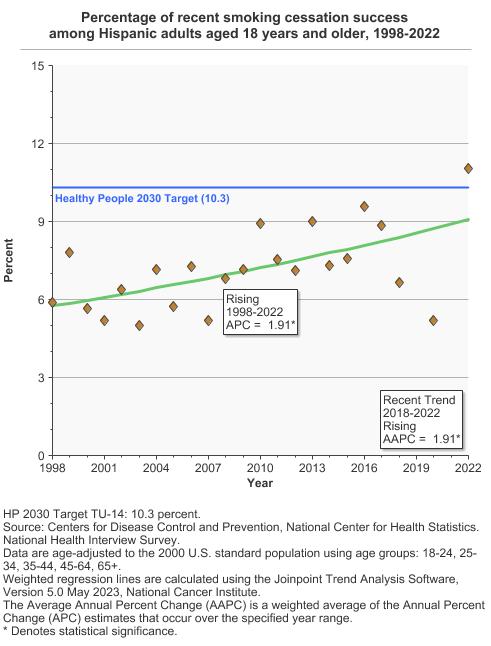
Percentage of recent smoking cessation success among adults aged 18 years and older by race/ethnicity, 1998-2022 Overview Graph Detailed Trend Graphs Most Recent Estimates (2022) Percent 95% Confidence Interval 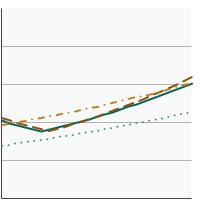
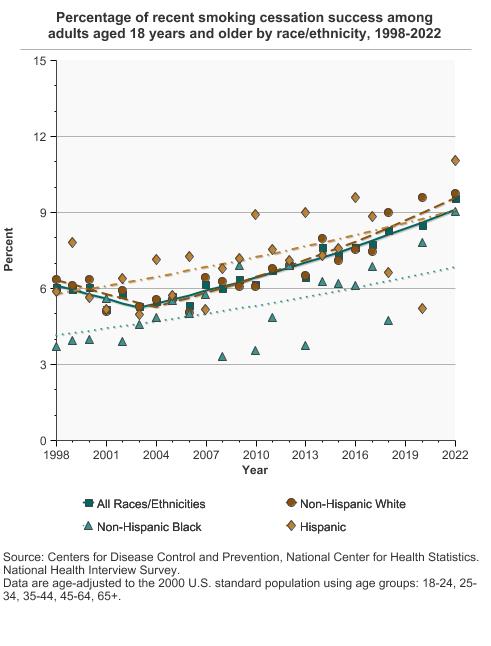
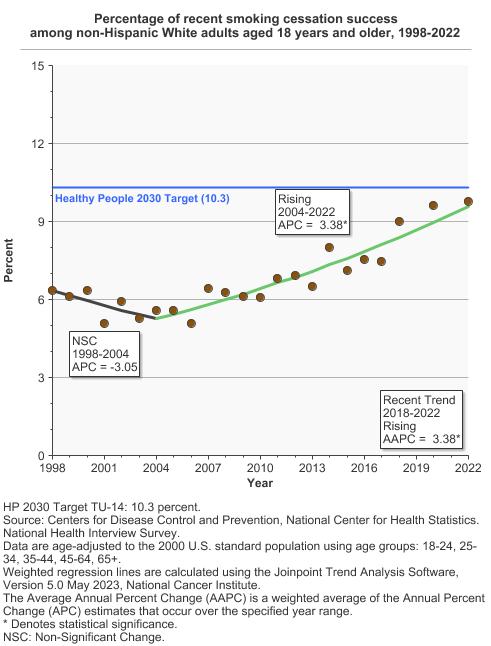
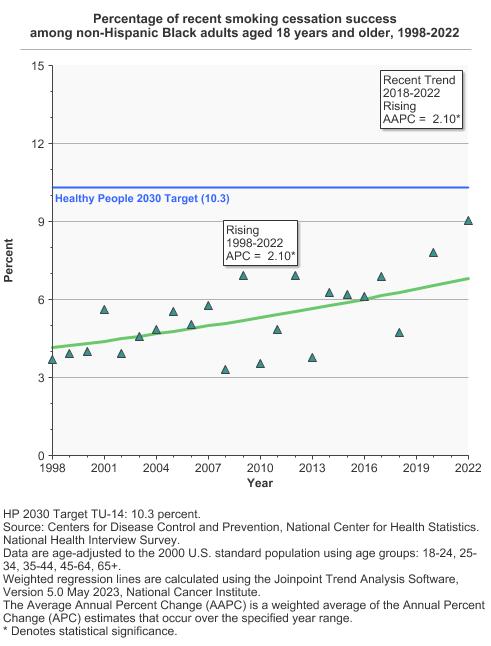
All Races/Ethnicities 9.6 8.4 - 10.9 Non-Hispanic White 9.8 8.3 - 11.4 Non-Hispanic Black 9.0 5.0 - 15.8 Hispanic 11.0 7.9 - 15.2 - By Age
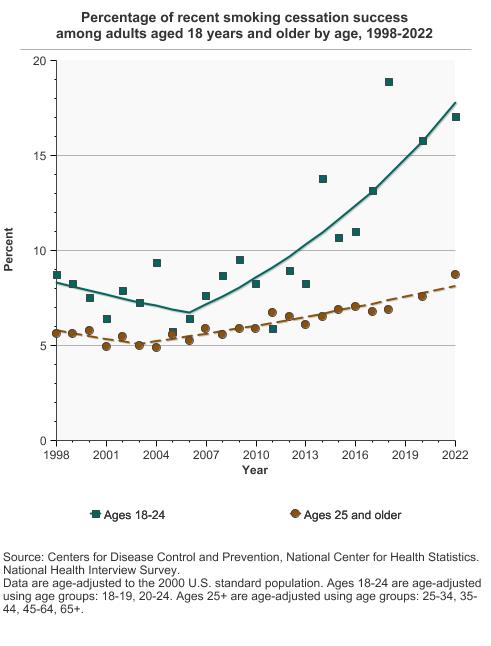
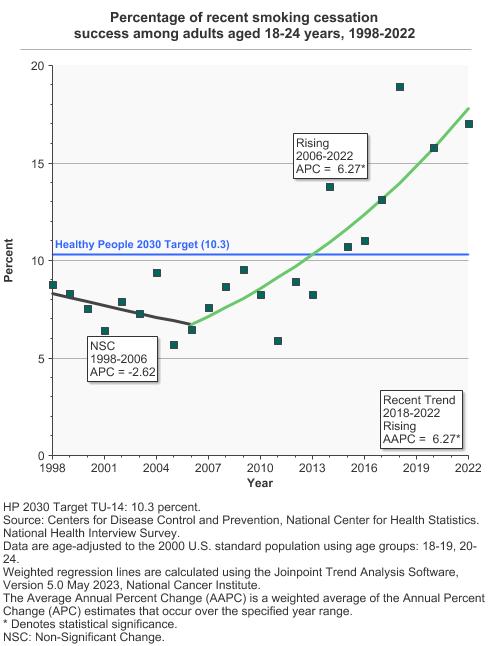
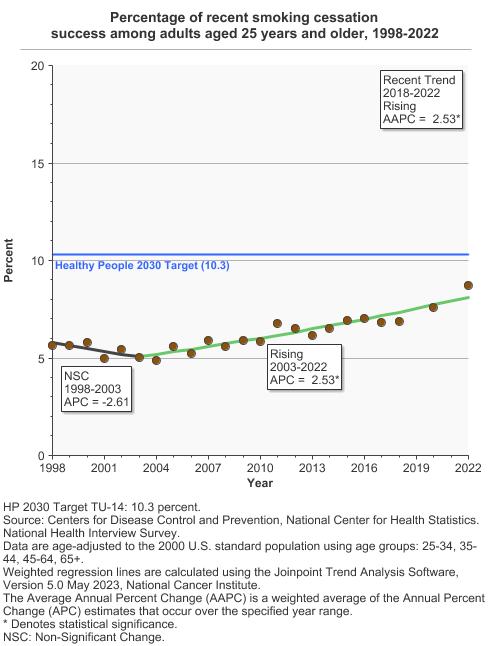
Percentage of recent smoking cessation success among adults aged 18 years and older by age, 1998-2022 Overview Graph Detailed Trend Graphs Most Recent Estimates (2022) Percent 95% Confidence Interval 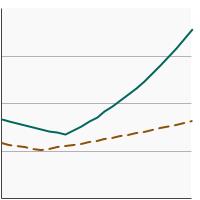
Ages 18-24 17.0 9.6 - 28.5 Ages 25 and older 8.7 7.6 - 10.0 - By Poverty Income Level
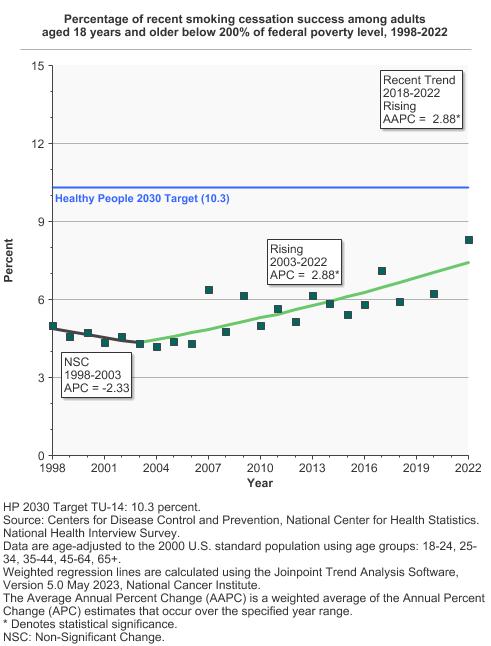
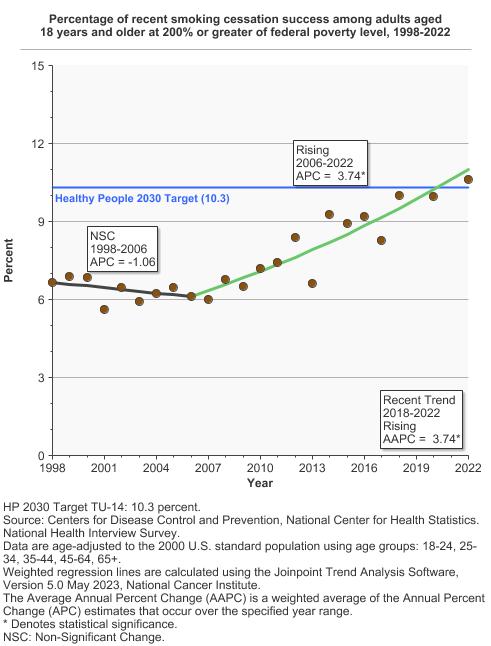
Percentage of recent smoking cessation success among adults aged 18 years and older by poverty income level, 1998-2022 Overview Graph Detailed Trend Graphs Most Recent Estimates (2022) Percent 95% Confidence Interval 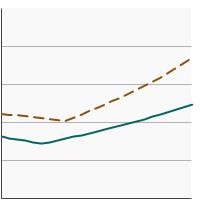
<200% of federal poverty level 8.3 6.7 - 10.3 >=200% of federal poverty level 10.6 8.9 - 12.5 - By Education Level
Percentage of recent smoking cessation success among adults aged 25 years and older by highest level of education obtained, 1998-2022 Overview Graph Detailed Trend Graphs Most Recent Estimates (2022) Percent 95% Confidence Interval 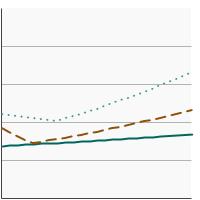
Less than High School 4.0 2.5 - 6.4 High School 7.5 6.0 - 9.4 Greater than High School 11.0 9.3 - 13.0


Additional Information
- Tobacco. National Cancer Institute.
- Smoking & Tobacco Use – Quit Smoking. Centers for Disease Control and Prevention.
- Public Health Education. U.S. Food and Drug Administration.
Quitting Smoking Resources
- Smokefree.gov. National Cancer Institute.
- Cigarette Smoking: Health Risks and How to Quit (PDQ®)–Patient Version. National Cancer Institute.
- How to Quit Using Tobacco. American Cancer Society.
- How to Quit Smoking. Centers for Disease Control and Prevention.
- A Socioecological Approach to Addressing Tobacco-Related Health Disparities. U.S. National Cancer Institute. National Cancer Institute Tobacco Control Monograph 22. NIH Publication No. 17-CA-8035A. Bethesda, MD: U.S. Department of Health and Human Services, National Institutes of Health, National Cancer Institute; 2017.
- The Economics of Tobacco and Tobacco Control. U.S. National Cancer Institute and World Health Organization. National Cancer Institute Tobacco Control Monograph 21. NIH Publication No. 16-CA-8029A. Bethesda, MD: U.S. Department of Health and Human Services, National Institutes of Health, National Cancer Institute; and Geneva, CH: World Health Organization; 2016.
- Tobacco Control Evidence-Based Programs Listing. National Cancer Institute.
- Smoking Cessation: A Report of the Surgeon General. Centers for Disease Control and Prevention.
- Healthcare Provider Resources: Smoking and Tobacco Use. Centers for Disease Control and Prevention.
- North American Quitline Consortium. North American Quitline Consortium.
- Monitoring the Increase in the U.S. Smoking Cessation Rate and Its Implication for Future Smoking Prevalence. Méndez D, Le TTT, Warner KE. Nicotine Tob Res. 2022 Oct 26;24(11):1727-1731.
- Prevalence and determinants of cigarette smoking relapse among US adult smokers: a longitudinal study. Alboksmaty A, Agaku IT, Odani S, Filippidis FT. BMJ Open. 2019;9(11):e031676.
- State-Specific Prevalence of Adult Tobacco Product Use and Cigarette Smoking Cessation Behaviors, United States, 2018–2019. Cornelius ME, Wang TW, Jamal A, et al. MMWR Morb Mortal Wkly Rep. 2023 Nov 23;20:E107.
- State Tobacco Excise Taxation, Comprehensive Smoke-free Air Laws, and Tobacco Control Appropriations as Predictors of Smoking Cessation Success in the United States. Dahne J, Nahhas GJ, Wahlquist AE, Cummings KM, Carpenter MJ. J Public Health Manag Pract. 2020;26(5):E1-E4.
- Relapse Prevention Interventions for Smoking Cessation. Livingstone-Banks J, Norris E, Hartmann-Boyce J, et al. Cochrane Database Syst Rev. 2019;2019(10).
- Longitudinal Associations Between Use of Tobacco and Cannabis Among People Who Smoke Cigarettes in Real-world Smoking Cessation Treatment. Nguyen N, Neilands TB, Lisha NE, Lyu JC, Olson SS, Ling PM.J Addict Med. 2022 Jul-Aug 01;16(4):413-419.
- Heterogeneity in Past-Year Smoking, Current Tobacco Use, and Smoking Cessation Behaviors Among Light and/or Non-Daily Smokers. Omole T, McNeel T, Choi K. Tob Induc Dis. 2020;18:74.
- Intersectionality and Smoking Cessation: Exploring Various Approaches for Understanding Health Inequities. Potter LN, Lam CY, Cinciripini PM, Wetter DW. Nicotine Tob Res. 2021 Jan 7;23(1):115-123. doi: 10.1093/ntr/ntaa052. PMID: 32208484; PMCID: PMC7789945.
- Enhancing employer coverage of smoking cessation treatment: A randomized trial of the Partners in Helping You Quit (PiHQ) program. Rigotti NA, Kelley JHK, Regan S, et al. Prev Med. 2020;140:106216.
- Adult smoking cessation – United States, 2022. VanFrank B, Malarcher A, Cornelius ME, et al. MMWR Morb Mortal Wkly Rep 2024;73:633–641.
- The Tobacco Use Supplement to the Current Population Survey. National Cancer Institute.
- The National Health Interview Survey Cancer Control Supplements. National Center for Health Statistics, co-sponsored by the National Cancer institute/DCCPS and the Centers for Disease Control and Prevention/OSH and DCPC.
- Population Assessment of Tobacco and Health (PATH) Study Series. National Institute on Drug Abuse, National Institutes of Health, and the Center for Tobacco Products, Food and Drug Administration.