On This Page:
- Background
- Measure
- Healthy People 2030 Target
- Data Source
- Trends and Most Recent Estimates
- Related Cancers
- Additional Information
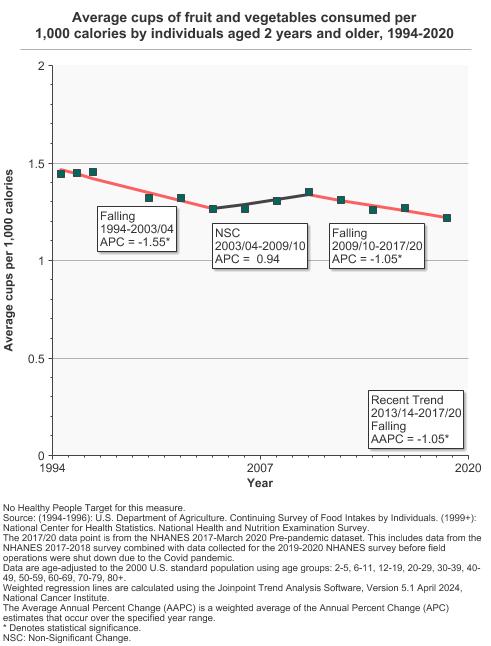
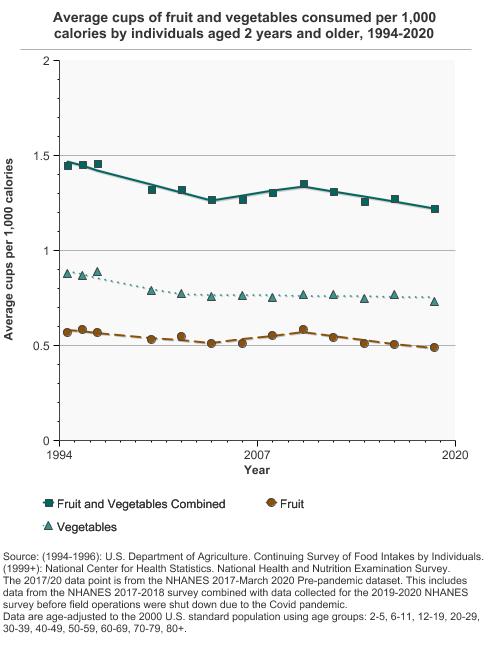
From 2017 to 2020, people aged 2 years and older consumed 1.2 cups of fruit and vegetables per 1,000 calories.
Background
People whose diets are rich in plant foods such as fruits and vegetables have a lower risk of getting cancers of the mouth, pharynx, larynx, esophagus, stomach, and lung, and some evidence suggests that maintaining a diet rich in plant foods also lowers the risk of cancers of the colon, pancreas, and prostate. This diet also reduces the risk of diabetes, heart disease, and hypertension, helps to reduce calorie intake, and may help to control weight.
To help prevent the aforementioned cancers and other chronic diseases, experts recommend the daily consumption of 2 to 6.5 cups of fruits and vegetables, depending on one’s energy needs. This includes 1 to 2.5 cups of fruits and 1 to 4 cups of vegetables, with special emphasis on dark green and orange vegetables and legumes. There is no evidence that the popular white potato protects against cancer.
Measure
Average daily cup equivalents per 1,000 calories of fruits and vegetables for people aged 2 years and older. This measure includes fruits and vegetables from all sources.
Data Source
U.S. Department of Agriculture, Agricultural Research Service, Beltsville Human Nutrition Research Center, Food Surveys Research Group (Beltsville, MD). Continuing Survey of Food Intakes by Individuals 1994-96.
Centers for Disease Control and Prevention, National Center for Health Statistics, National Health and Nutrition Examination Survey (NHANES).
The NHANES 2017-2018 data point was replaced with the NHANES 2017-March 2020 Pre-pandemic data point. More information is available at NHANES Questionnaires, Datasets, and Related Documentation.
Healthy People 2030 Target
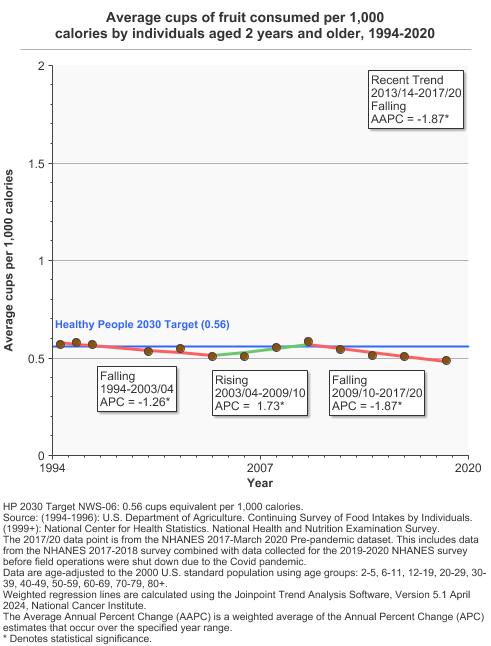
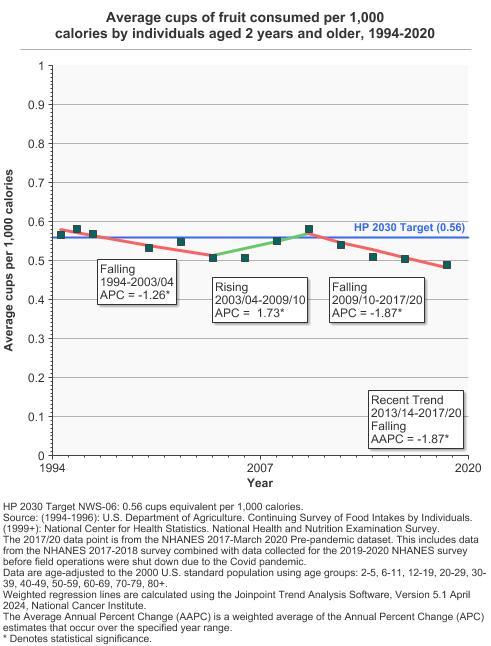
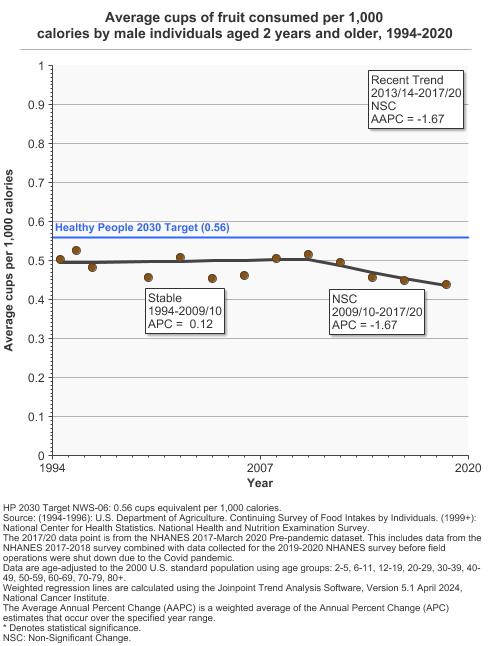
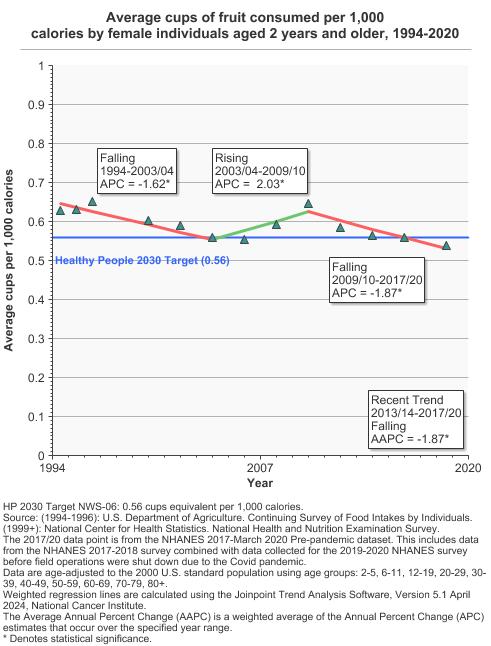
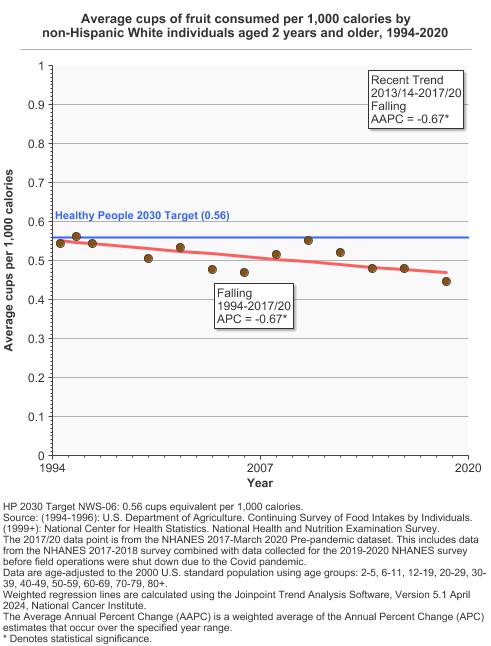
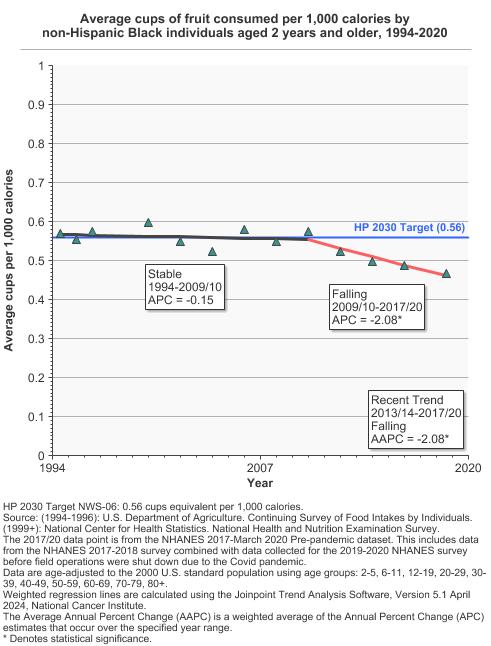
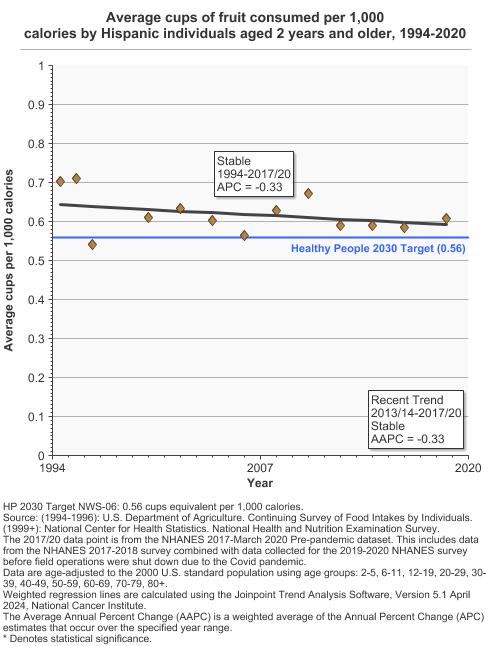
- Increase the consumption of fruits by persons aged 2 years and over to 0.56 cup equivalents of fruit per 1,000 calories.
- Increase the consumption of total vegetables by persons aged 2 years and over to 0.84 cup equivalents of total vegetables per 1,000 calories.
Healthy People 2030 is a set of goals set forth by the Department of Health and Human Services.
Note: Goals are indicated as blue line on Detailed Trend Graphs.
Trends and Most Recent Estimates
- Overall Comparison
Average cups of fruit and vegetables consumed per 1,000 calories by individuals aged 2 years and older, 1994-2020 Overview Graph Detailed Trend Graphs Most Recent Estimates (2017 to 2020) Average cups per 1,000 calories 95% Confidence Interval 

Fruit and Vegetables Combined 
1.2 1.2 - 1.3 Fruit 0.5 0.5 - 0.5 Vegetables 0.7 0.7 - 0.8 The 2017 to 2020 data point is from the NHANES 2017-March 2020 Pre-pandemic dataset. This includes data from the NHANES 2017-2018 survey combined with data collected for the 2019-2020 NHANES survey before field operations were shut down due to the Covid pandemic. - Fruit and Vegetables Combined
- By Sex
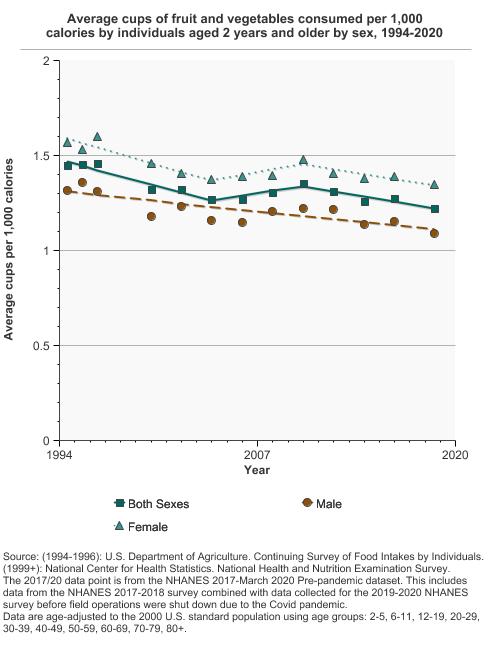
Average cups of fruit and vegetables consumed per 1,000 calories by individuals aged 2 years and older by sex, 1994-2020 Overview Graph Detailed Trend Graphs Most Recent Estimates (2017 to 2020) Average cups per 1,000 calories 95% Confidence Interval 
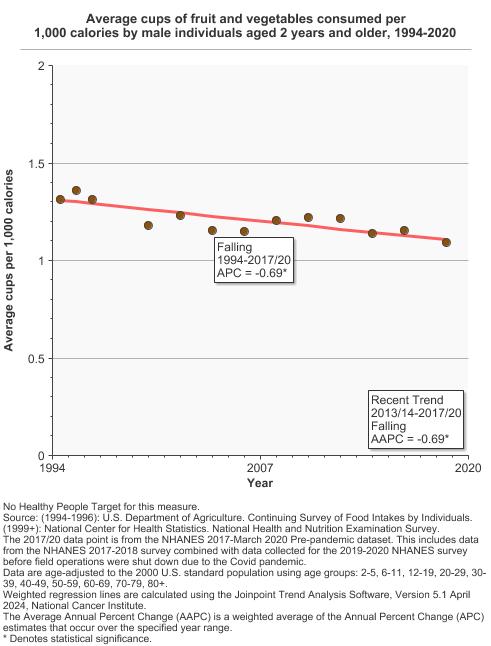
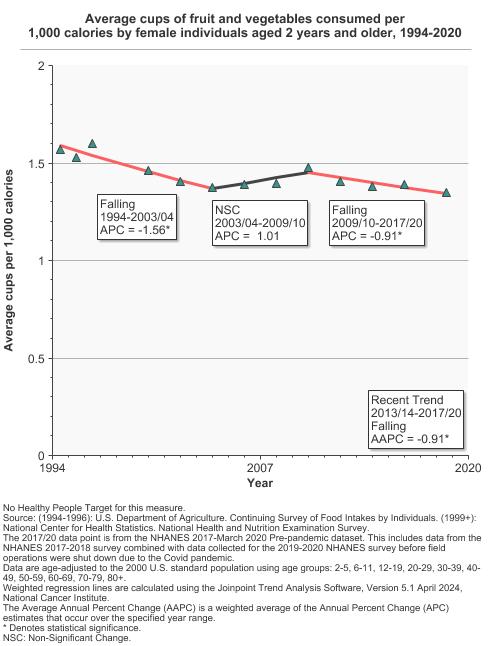
Both Sexes 1.2 1.2 - 1.3 Male 1.1 1.0 - 1.1 Female 1.3 1.3 - 1.4 The 2017 to 2020 data point is from the NHANES 2017-March 2020 Pre-pandemic dataset. This includes data from the NHANES 2017-2018 survey combined with data collected for the 2019-2020 NHANES survey before field operations were shut down due to the Covid pandemic. - By Race/Ethnicity
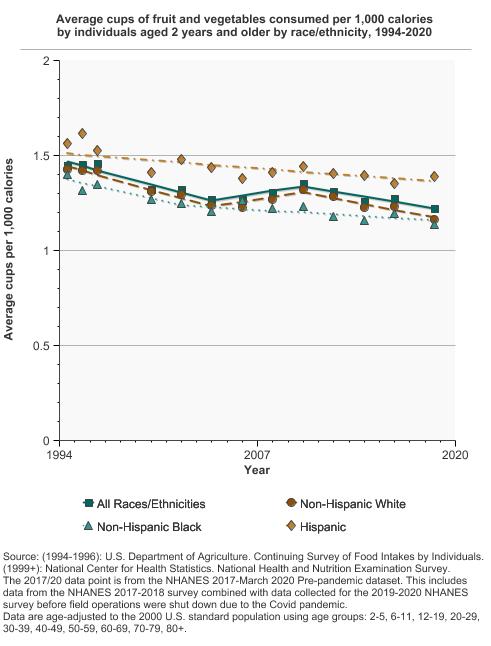
Average cups of fruit and vegetables consumed per 1,000 calories by individuals aged 2 years and older by race/ethnicity, 1994-2020 Overview Graph Detailed Trend Graphs Most Recent Estimates (2017 to 2020) Average cups per 1,000 calories 95% Confidence Interval 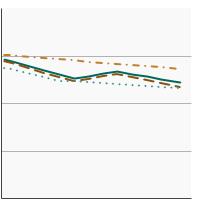
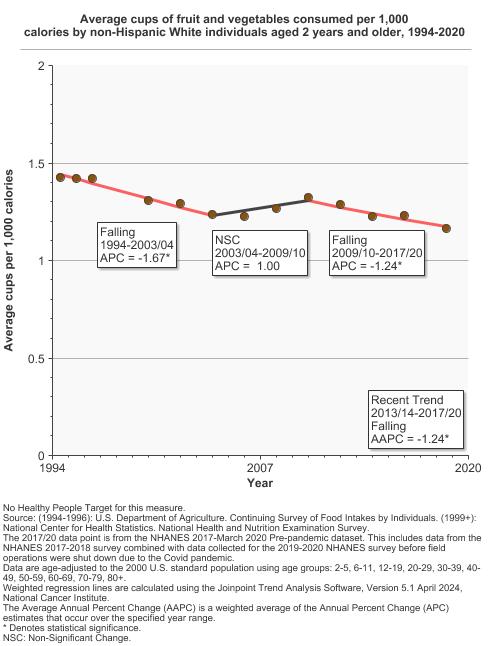
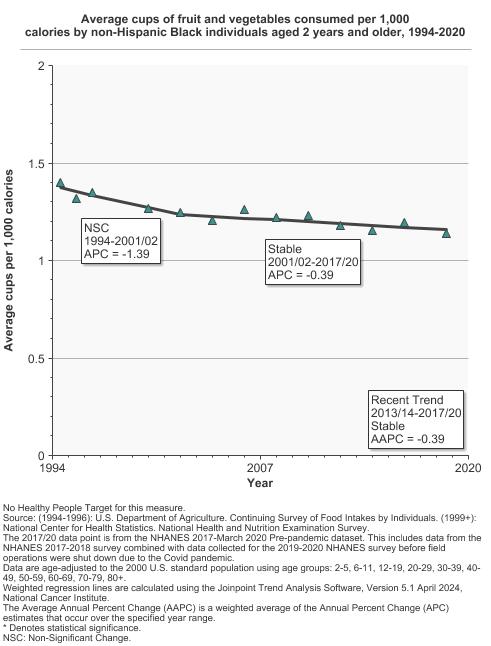
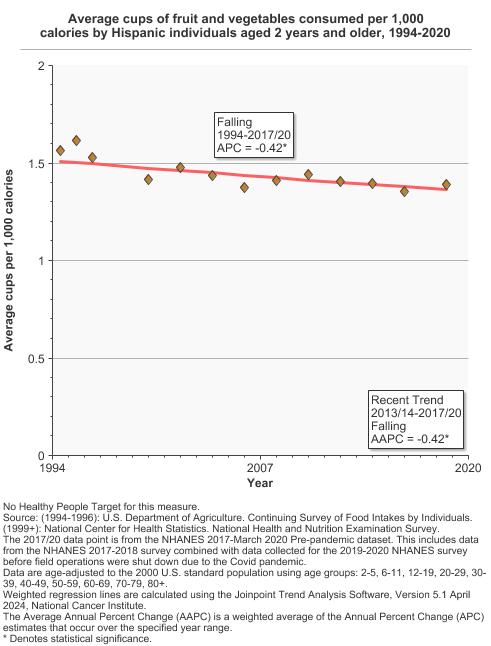
All Races/Ethnicities 1.2 1.2 - 1.3 Non-Hispanic White 1.2 1.1 - 1.2 Non-Hispanic Black 1.1 1.1 - 1.2 Hispanic 1.4 1.3 - 1.5 The 2017 to 2020 data point is from the NHANES 2017-March 2020 Pre-pandemic dataset. This includes data from the NHANES 2017-2018 survey combined with data collected for the 2019-2020 NHANES survey before field operations were shut down due to the Covid pandemic. - By Poverty Income Level
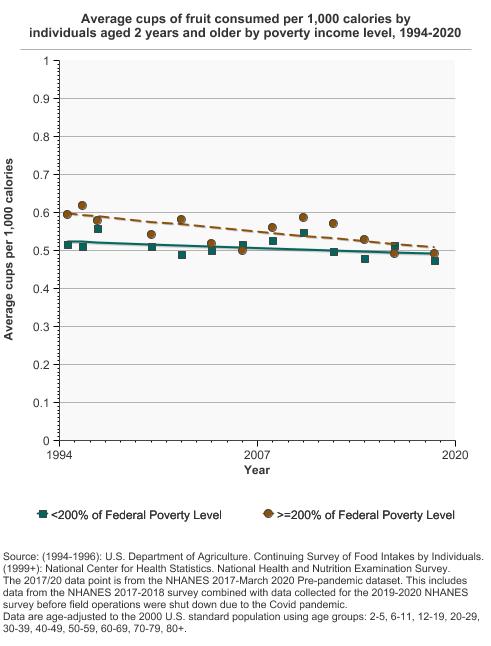
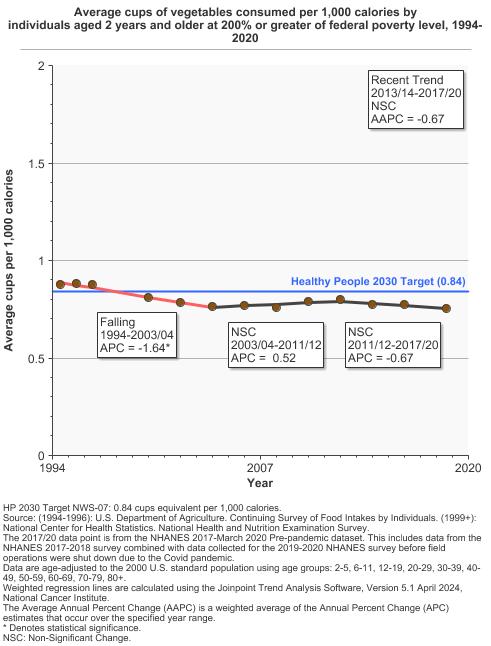
Average cups of fruit and vegetables consumed per 1,000 calories by individuals aged 2 years and older by poverty income level, 1994-2020 Overview Graph Detailed Trend Graphs Most Recent Estimates (2017 to 2020) Average cups per 1,000 calories 95% Confidence Interval 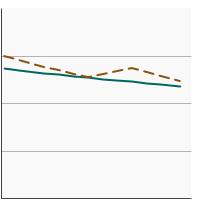
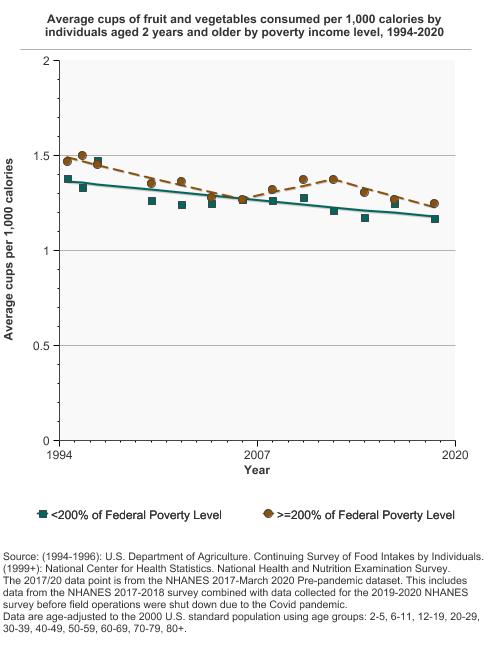
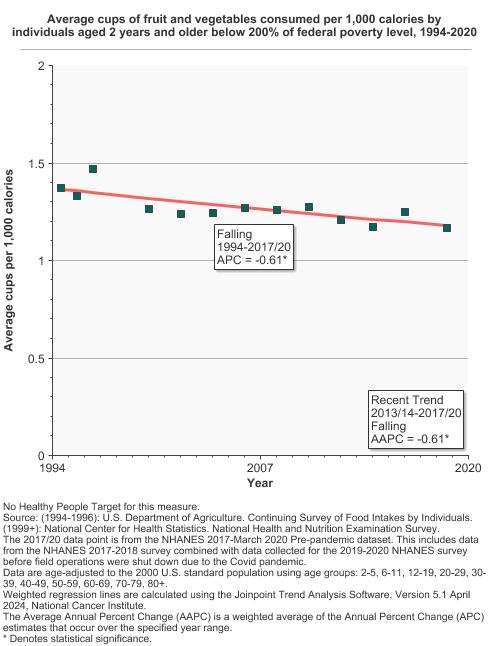
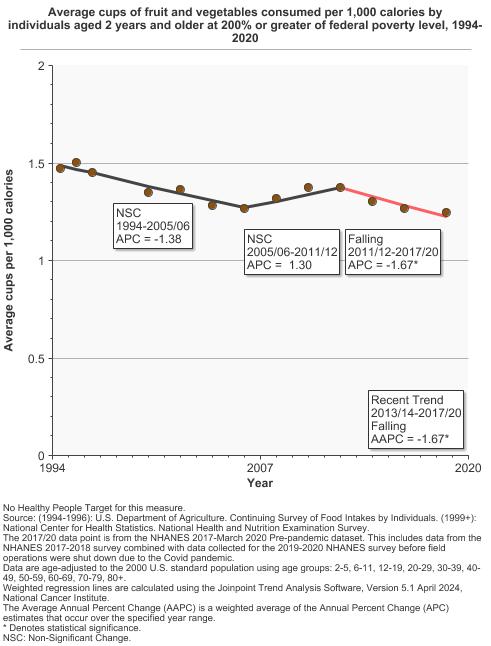
<200% of Federal Poverty Level 1.2 1.1 - 1.2 >=200% of Federal Poverty Level 1.2 1.2 - 1.3 The 2017 to 2020 data point is from the NHANES 2017-March 2020 Pre-pandemic dataset. This includes data from the NHANES 2017-2018 survey combined with data collected for the 2019-2020 NHANES survey before field operations were shut down due to the Covid pandemic.
- Fruit
- By Sex
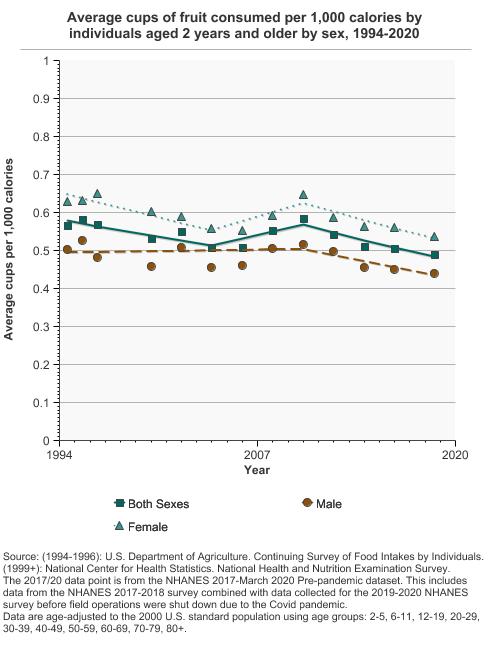
Average cups of fruit consumed per 1,000 calories by individuals aged 2 years and older by sex, 1994-2020 Overview Graph Detailed Trend Graphs Most Recent Estimates (2017 to 2020) Average cups per 1,000 calories 95% Confidence Interval 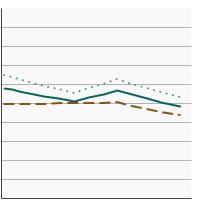
Both Sexes 0.5 0.5 - 0.5 Male 0.4 0.4 - 0.5 Female 0.5 0.5 - 0.6 The 2017 to 2020 data point is from the NHANES 2017-March 2020 Pre-pandemic dataset. This includes data from the NHANES 2017-2018 survey combined with data collected for the 2019-2020 NHANES survey before field operations were shut down due to the Covid pandemic. - By Race/Ethnicity
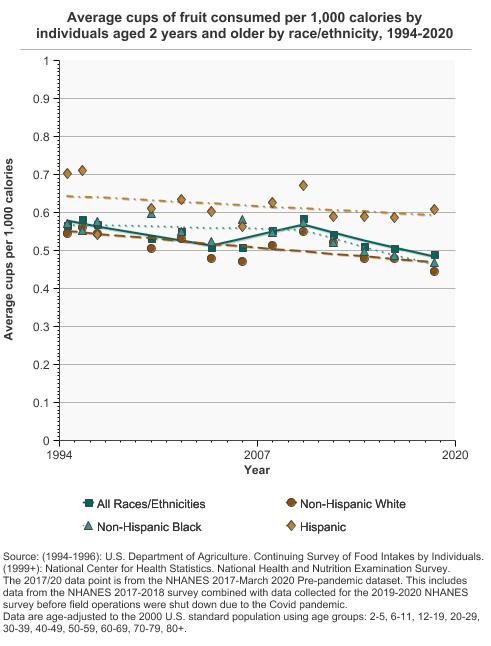
Average cups of fruit consumed per 1,000 calories by individuals aged 2 years and older by race/ethnicity, 1994-2020 Overview Graph Detailed Trend Graphs Most Recent Estimates (2017 to 2020) Average cups per 1,000 calories 95% Confidence Interval 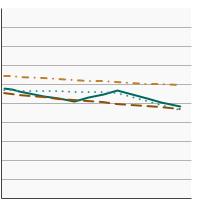
All Races/Ethnicities 0.5 0.5 - 0.5 Non-Hispanic White 0.4 0.4 - 0.5 Non-Hispanic Black 0.5 0.4 - 0.5 Hispanic 0.6 0.5 - 0.7 The 2017 to 2020 data point is from the NHANES 2017-March 2020 Pre-pandemic dataset. This includes data from the NHANES 2017-2018 survey combined with data collected for the 2019-2020 NHANES survey before field operations were shut down due to the Covid pandemic. - By Poverty Income Level
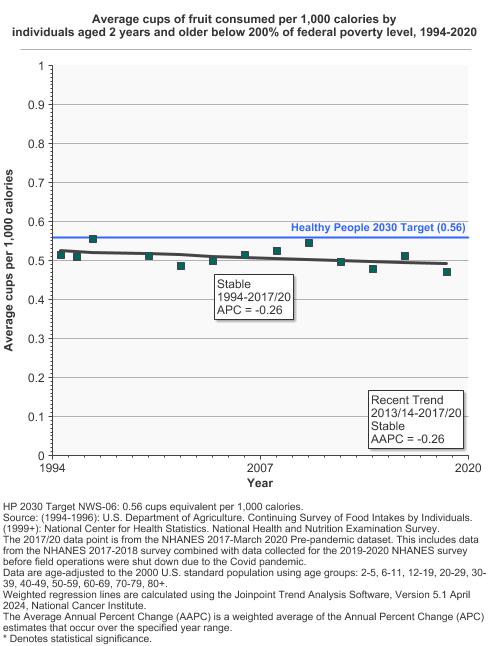
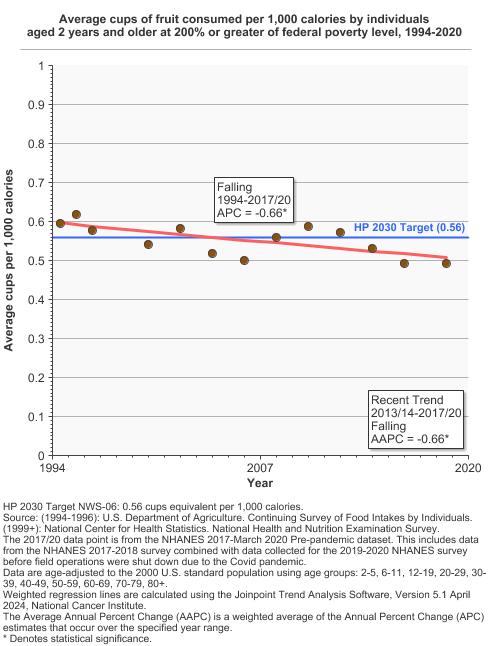
Average cups of fruit consumed per 1,000 calories by individuals aged 2 years and older by poverty income level, 1994-2020 Overview Graph Detailed Trend Graphs Most Recent Estimates (2017 to 2020) Average cups per 1,000 calories 95% Confidence Interval 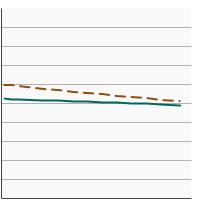
<200% of Federal Poverty Level 0.5 0.4 - 0.5 >=200% of Federal Poverty Level 0.5 0.5 - 0.5 The 2017 to 2020 data point is from the NHANES 2017-March 2020 Pre-pandemic dataset. This includes data from the NHANES 2017-2018 survey combined with data collected for the 2019-2020 NHANES survey before field operations were shut down due to the Covid pandemic.
- Vegetables
- By Sex
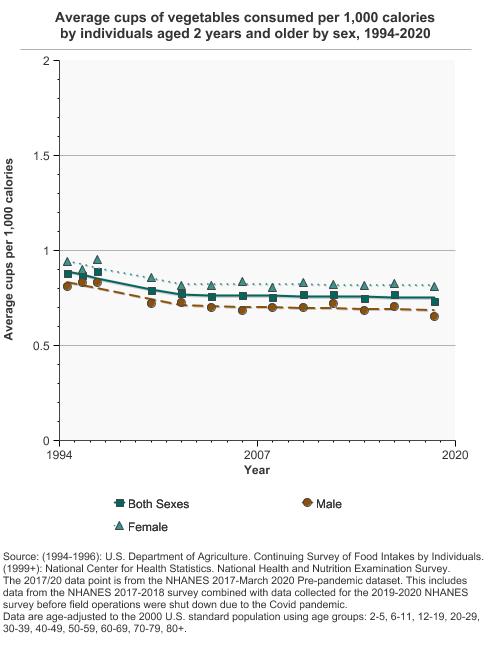
Average cups of vegetables consumed per 1,000 calories by individuals aged 2 years and older by sex, 1994-2020 Overview Graph Detailed Trend Graphs Most Recent Estimates (2017 to 2020) Average cups per 1,000 calories 95% Confidence Interval 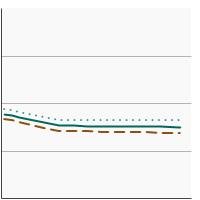
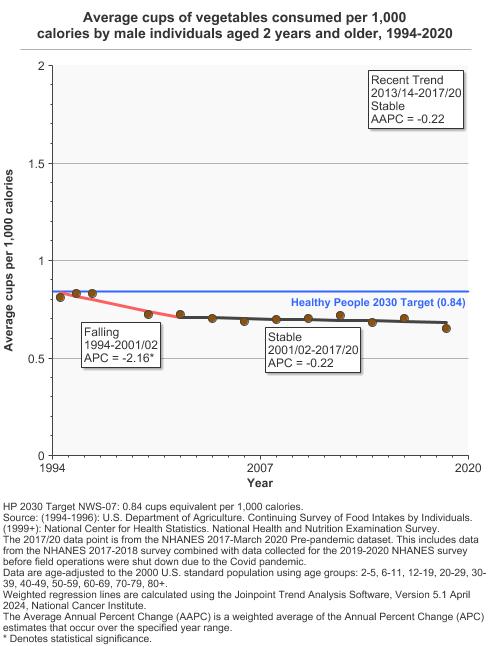
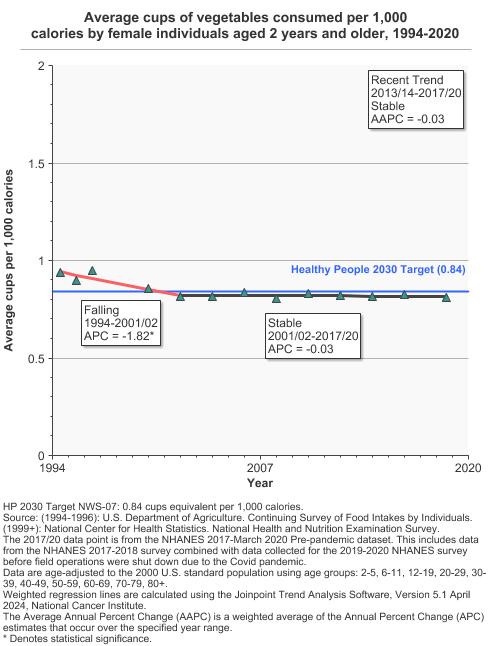
Both Sexes 0.7 0.7 - 0.8 Male 0.7 0.6 - 0.7 Female 0.8 0.8 - 0.9 The 2017 to 2020 data point is from the NHANES 2017-March 2020 Pre-pandemic dataset. This includes data from the NHANES 2017-2018 survey combined with data collected for the 2019-2020 NHANES survey before field operations were shut down due to the Covid pandemic. - By Race/Ethnicity
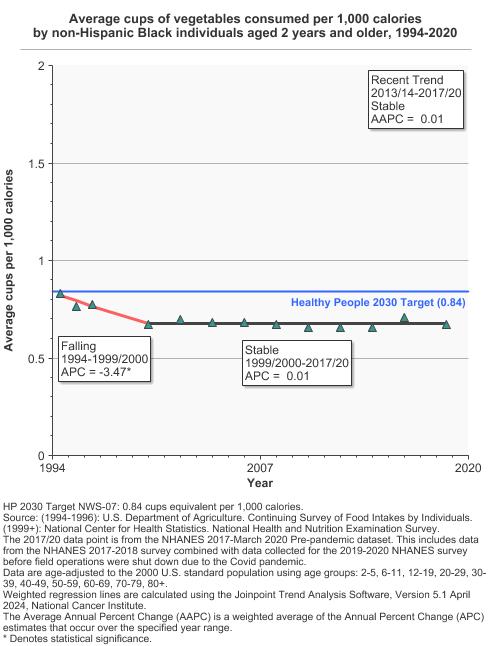
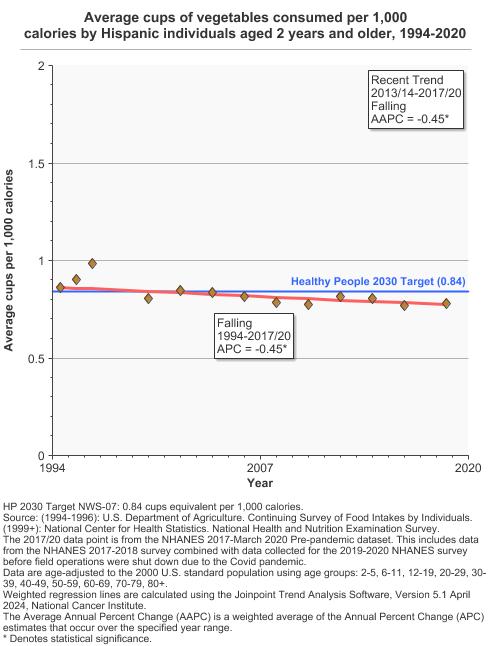
Average cups of vegetables consumed per 1,000 calories by individuals aged 2 years and older by race/ethnicity, 1994-2020 Overview Graph Detailed Trend Graphs Most Recent Estimates (2017 to 2020) Average cups per 1,000 calories 95% Confidence Interval 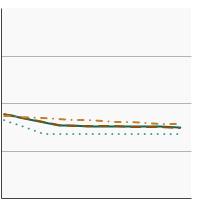
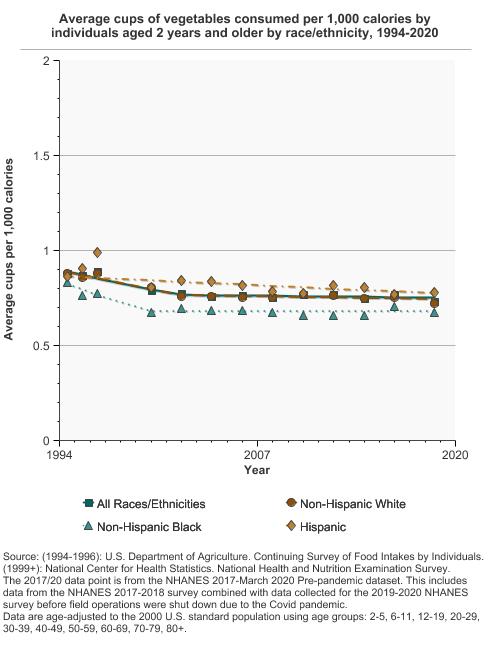
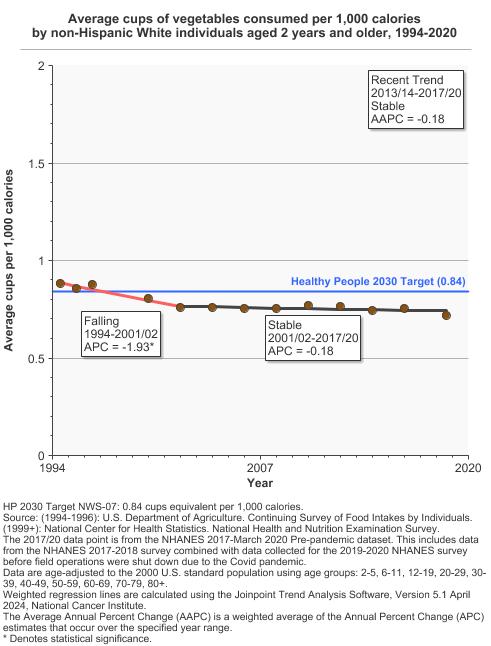
All Races/Ethnicities 0.7 0.7 - 0.8 Non-Hispanic White 0.7 0.7 - 0.8 Non-Hispanic Black 0.7 0.6 - 0.7 Hispanic 0.8 0.7 - 0.8 The 2017 to 2020 data point is from the NHANES 2017-March 2020 Pre-pandemic dataset. This includes data from the NHANES 2017-2018 survey combined with data collected for the 2019-2020 NHANES survey before field operations were shut down due to the Covid pandemic. - By Poverty Income Level
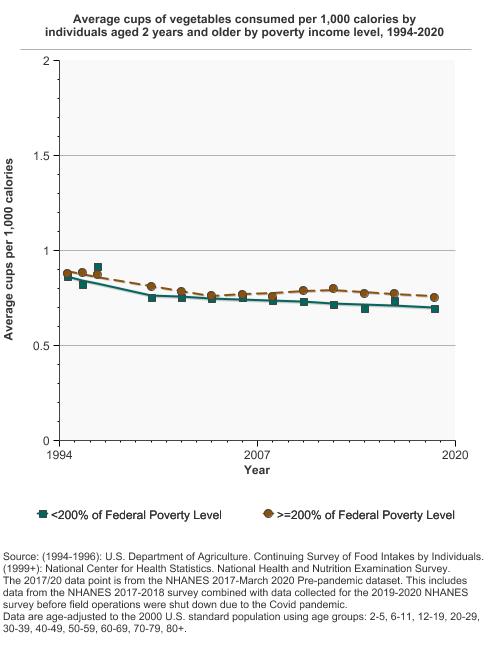
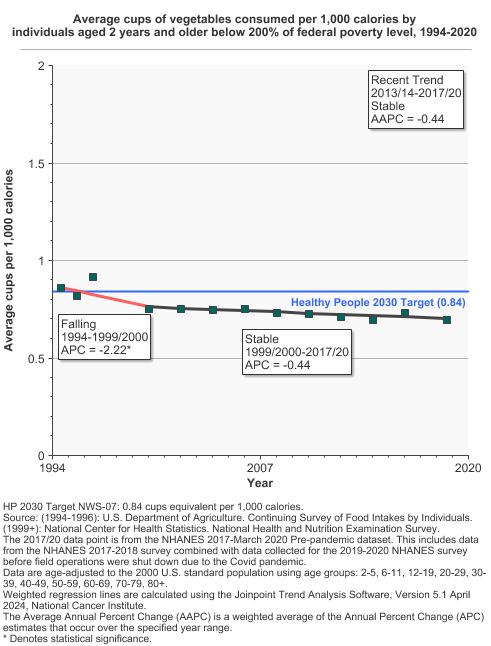
Average cups of vegetables consumed per 1,000 calories by individuals aged 2 years and older by poverty income level, 1994-2020 Overview Graph Detailed Trend Graphs Most Recent Estimates (2017 to 2020) Average cups per 1,000 calories 95% Confidence Interval 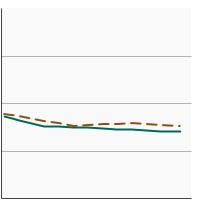
<200% of Federal Poverty Level 0.7 0.7 - 0.7 >=200% of Federal Poverty Level 0.8 0.7 - 0.8 The 2017 to 2020 data point is from the NHANES 2017-March 2020 Pre-pandemic dataset. This includes data from the NHANES 2017-2018 survey combined with data collected for the 2019-2020 NHANES survey before field operations were shut down due to the Covid pandemic.


Additional Information
- ACS Guideline on Nutrition and Physical Activity for Cancer Prevention. American Cancer Society.
- Diet and Physical Activity: What’s the Cancer Connection? American Cancer Society.
- Cancer Prevention and Control: Healthy Choices. Centers for Disease Control and Prevention.
- Diet/Nutrition Evidence-Based Programs Listing. National Cancer Institute.
- Nutrition, Physical Activity, and Obesity. Centers for Disease Control and Prevention. State, Tribal, Local, and Territorial Public Health Professionals Gateway.
- 2020-2025 Dietary Guidelines for Americans. U.S. Department of Agriculture and U.S. Department of Health and Human Services.
- Global Cancer Update Programme. World Cancer Research Fund International.
- Diet, Nutrition, Physical Activity, and Cancer: a Global Perspective. World Cancer Research Fund International and the American Institute for Cancer Research.
- American Cancer Society guideline for diet and physical activity for cancer prevention. Rock CL, Thomson C, Gansler T, et al. CA Cancer J Clin. 2020; 70(4): 245-271.
- Usual Dietary Intakes: Food Intakes, U.S. Population, 2007–10. National Cancer Institute.
- What We Eat in America. U.S. Department of Agriculture.