On This Page:
- Background
- Measure
- Healthy People 2030 Target
- Data Source
- Trends and Most Recent Estimates
- Related Cancers
- Additional Information
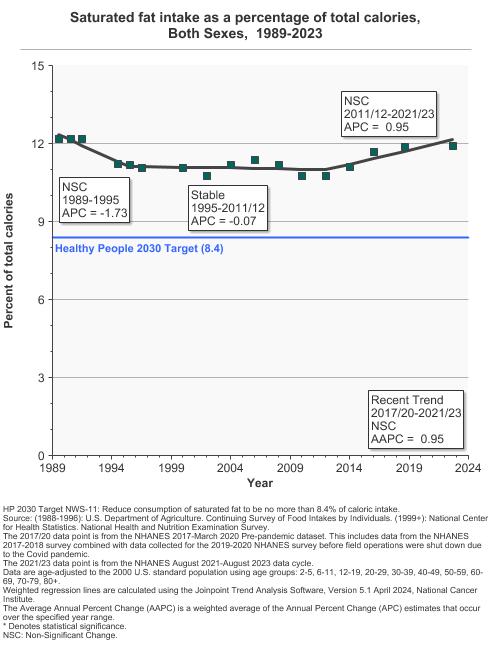
From 2021 to 2023, saturated fat accounted for 11.9% of the calories people consumed.
Background
Some studies suggest that high-fat diets or high intakes of different types of fat in the diet may be linked to several cancers, including colon, lung, and postmenopausal breast cancer, as well as heart disease and other chronic diseases.
More research is needed to better understand which types of fat should be avoided and how much of each type alters cancer risk. Although monounsaturated and polyunsaturated fatty acids have been studied for a number of years, their effects are still unclear. More recent research on the effects of trans fatty acids also has yet to reach definitive conclusions.
The 2020-2025 Dietary Guidelines for Americans, issued by the U.S. Department of Agriculture and the U.S. Department of Health and Human Services, recommend getting less than 10 percent of calories from saturated fatty acids and keeping trans fatty acid consumption as low as possible for general health and the prevention of chronic disease, including cancer and heart disease. The guidelines also recommend keeping total fat intake between 20 and 35 percent of calories for adults, with most fats coming from sources of polyunsaturated and monounsaturated fatty acids, such as fish, nuts, and vegetable oils.
Measure
Intakes of total fat, and of the major fatty acids - saturated, monounsaturated, and polyunsaturated - as a percentage of total calories.
Data Source
U.S. Department of Agriculture, Agricultural Research Service, Beltsville Human Nutrition Research Center, Food Surveys Research Group (Beltsville, MD). Continuing Survey of Food Intakes by Individuals 1989-1991, 1994-96.
Centers for Disease Control and Prevention, National Center for Health Statistics, National Health and Nutrition Examination Survey (NHANES).
The NHANES 2017-2018 data point was replaced with the NHANES 2017-March 2020 Pre-pandemic data point. More information is available at NHANES Questionnaires, Datasets, and Related Documentation.
Healthy People 2030 Target
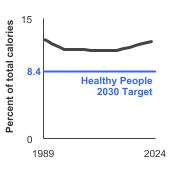
- Reduce the consumption of saturated fat by persons aged 2 years and over to 8.4 percent of calories consumed.
Healthy People 2030 is a set of goals set forth by the Department of Health and Human Services.
Note: Goals are indicated as blue line on Detailed Trend Graphs.
Trends and Most Recent Estimates
- Fat Intake Comparison
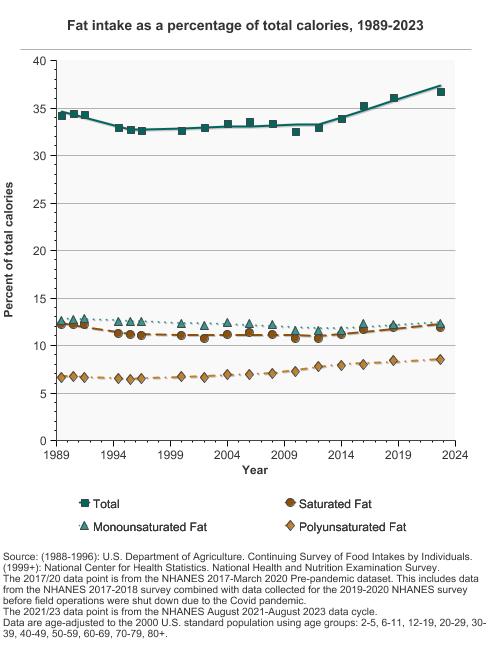
Fat intake as a percentage of total calories, 1989-2023 Overview Graph Detailed Trend Graphs Most Recent Estimates (2021 to 2023) Percent of total calories 95% Confidence Interval 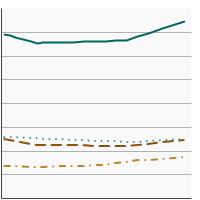

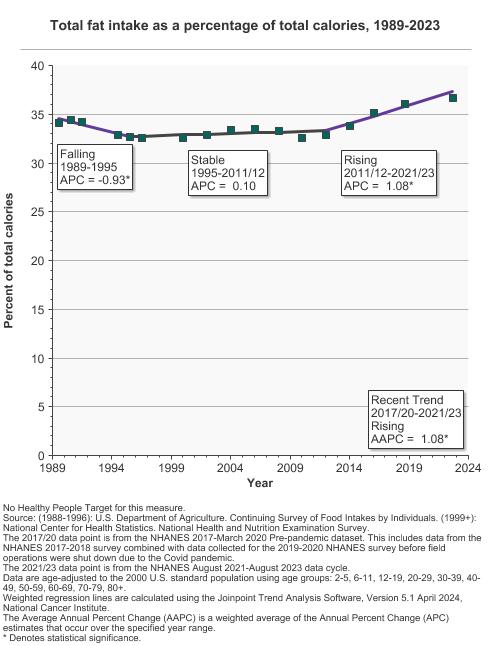
Total 
36.8 36.3 - 37.2 Saturated Fat 11.9 11.7 - 12.2 Monounsaturated Fat 12.3 12.2 - 12.5 Polyunsaturated Fat 8.5 8.3 - 8.6 The 2021 to 2023 data point is from the NHANES August 2021-August 2023 data cycle. - Total Fat Intake
- By Sex
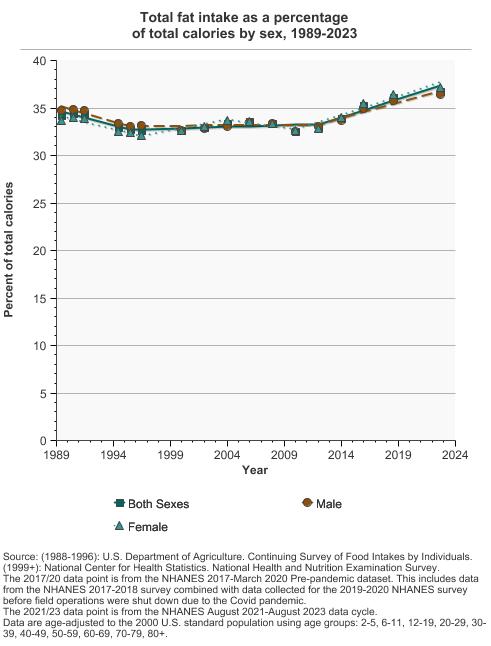
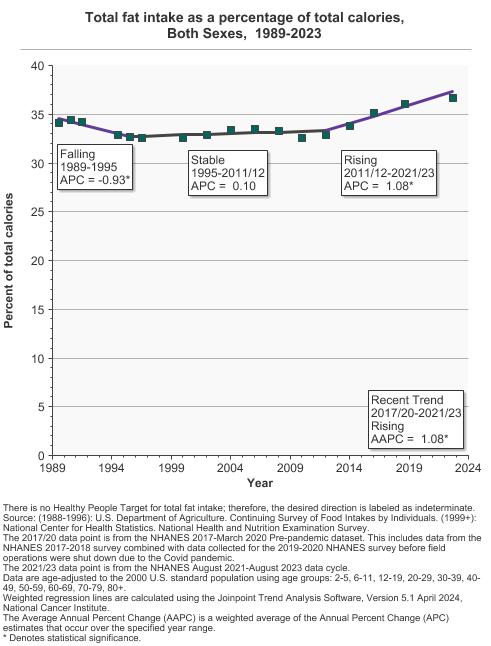
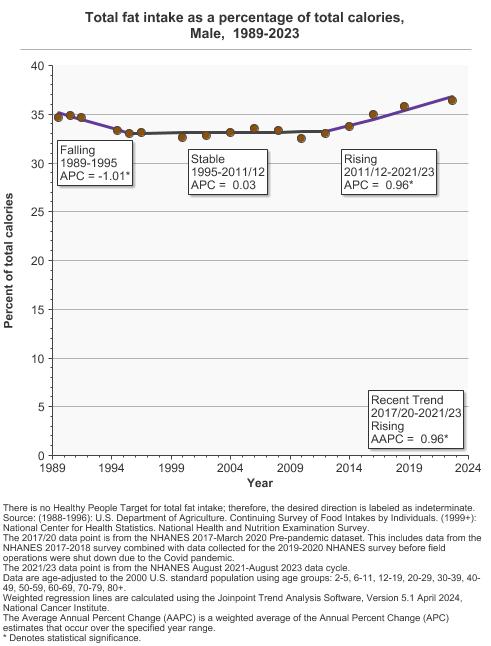
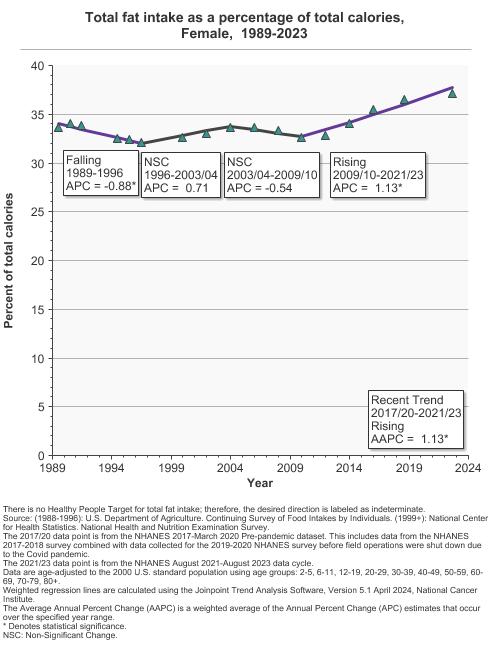
Total fat intake as a percentage of total calories by sex, 1989-2023 Overview Graph Detailed Trend Graphs Most Recent Estimates (2021 to 2023) Percent of total calories 95% Confidence Interval 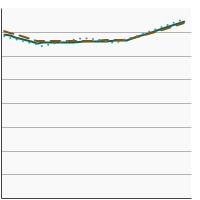
Both Sexes 36.8 36.3 - 37.2 Male 36.4 36.0 - 36.8 Female 37.1 36.5 - 37.8 The 2021 to 2023 data point is from the NHANES August 2021-August 2023 data cycle. - By Race/Ethnicity
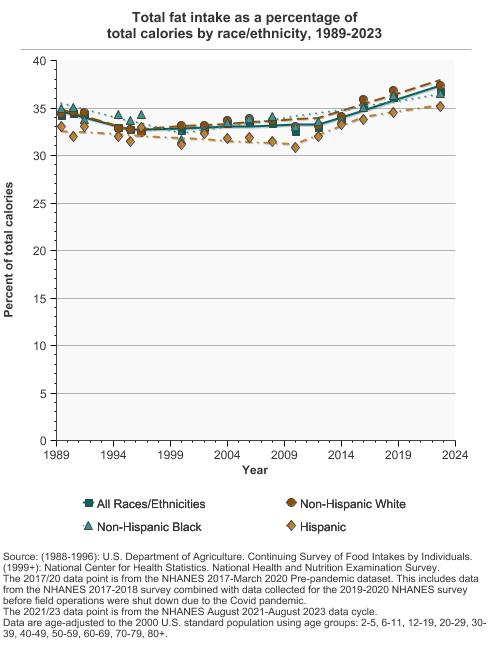
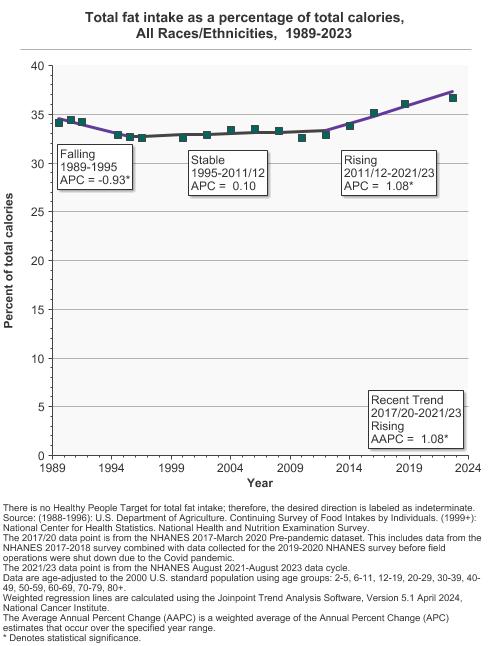
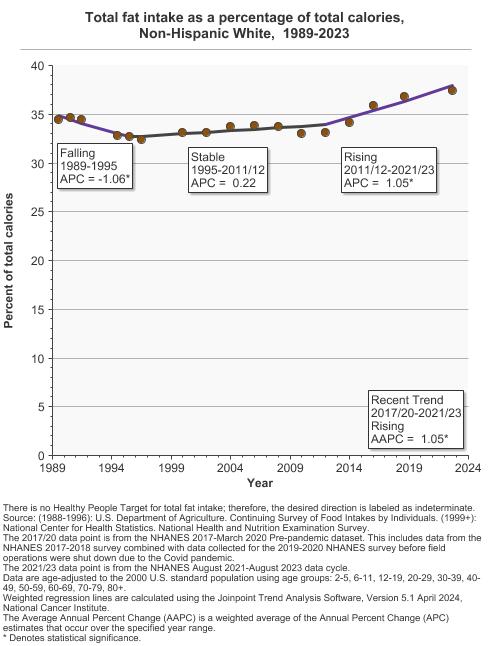
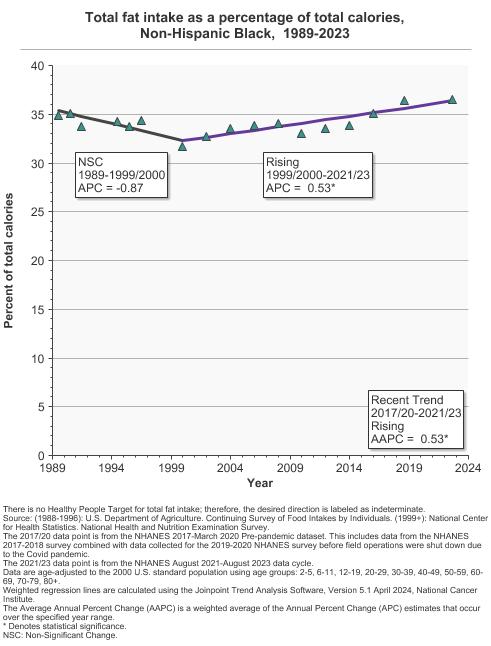
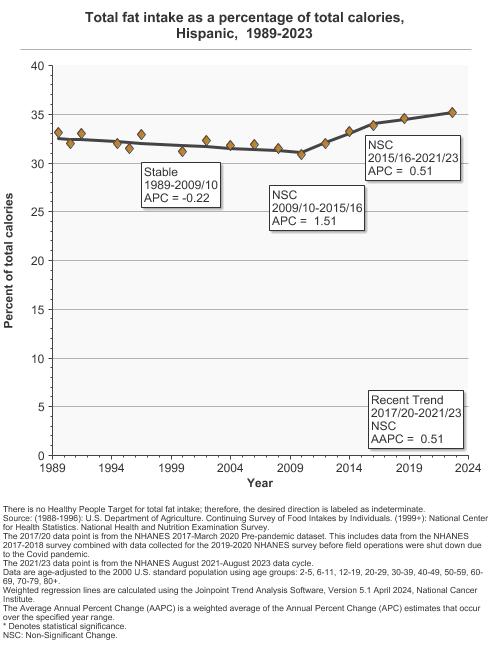
Total fat intake as a percentage of total calories by race/ethnicity, 1989-2023 Overview Graph Detailed Trend Graphs Most Recent Estimates (2021 to 2023) Percent of total calories 95% Confidence Interval 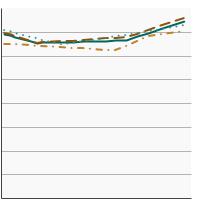
All Races/Ethnicities 36.8 36.3 - 37.2 Non-Hispanic White 37.4 36.9 - 37.9 Non-Hispanic Black 36.5 35.4 - 37.6 Hispanic 35.2 34.1 - 36.2 The 2021 to 2023 data point is from the NHANES August 2021-August 2023 data cycle. - By Poverty Income Level
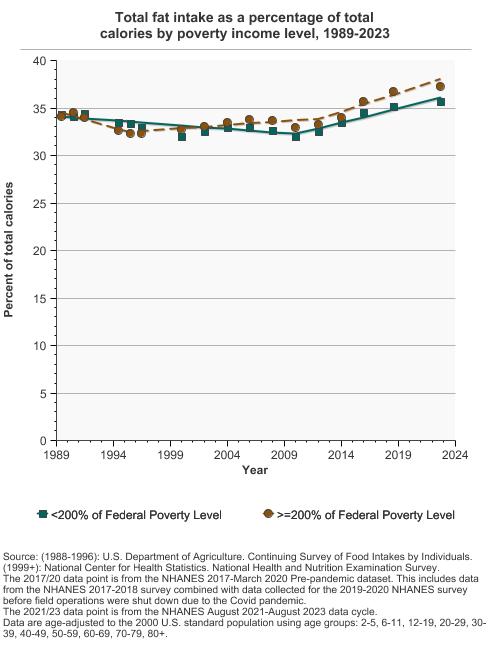
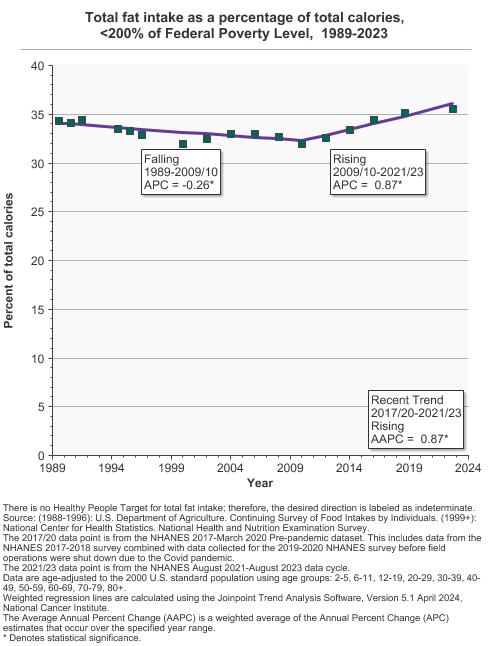
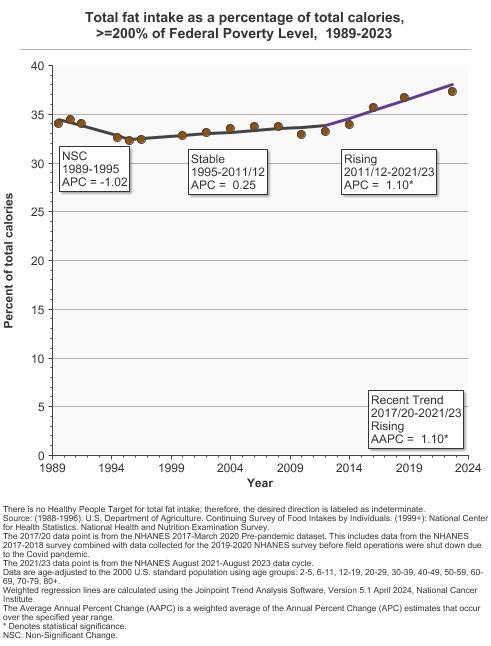
Total fat intake as a percentage of total calories by poverty income level, 1989-2023 Overview Graph Detailed Trend Graphs Most Recent Estimates (2021 to 2023) Percent of total calories 95% Confidence Interval 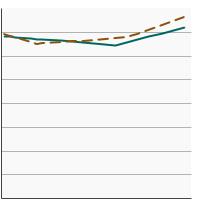
<200% of Federal Poverty Level 35.6 35.1 - 36.1 >=200% of Federal Poverty Level 37.3 36.6 - 38.0 The 2021 to 2023 data point is from the NHANES August 2021-August 2023 data cycle.
- Saturated Fat Intake
- By Sex
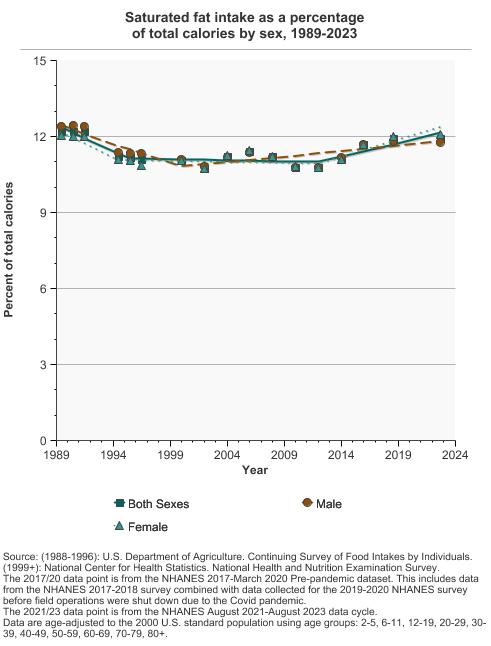
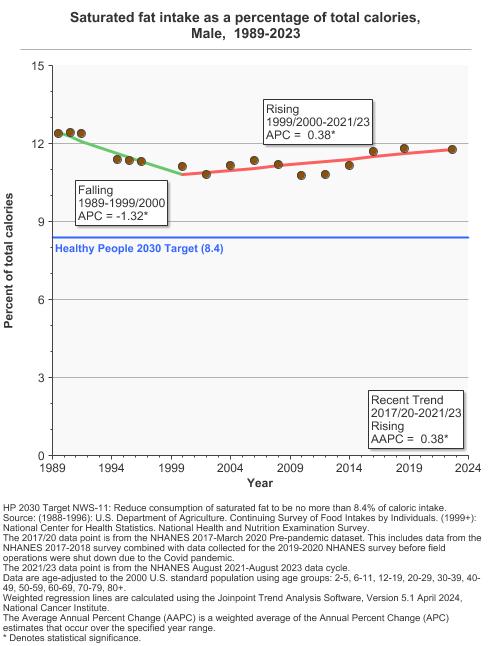
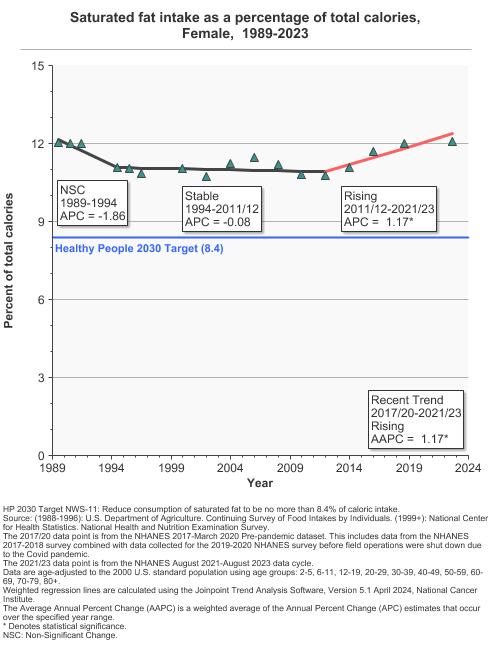
Saturated fat intake as a percentage of total calories by sex, 1989-2023 Overview Graph Detailed Trend Graphs Most Recent Estimates (2021 to 2023) Percent of total calories 95% Confidence Interval 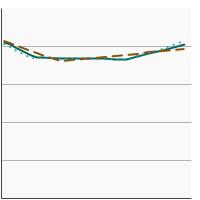
Both Sexes 11.9 11.7 - 12.2 Male 11.8 11.5 - 12.0 Female 12.1 11.7 - 12.4 The 2021 to 2023 data point is from the NHANES August 2021-August 2023 data cycle. - By Race/Ethnicity
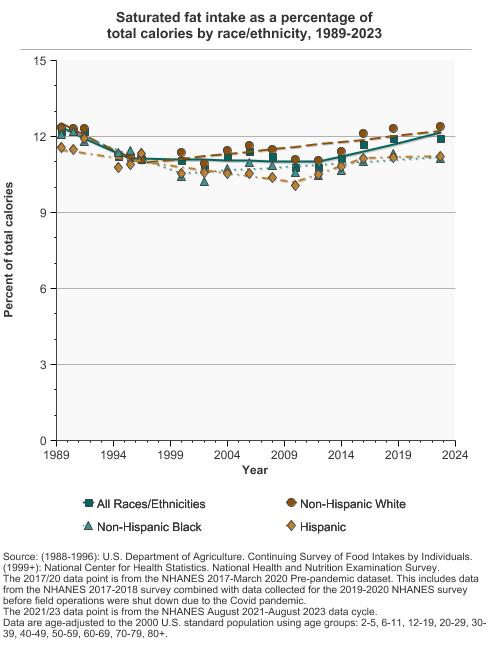
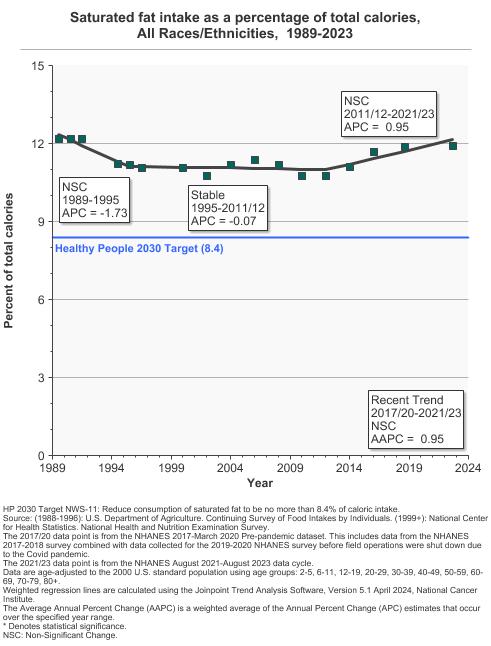
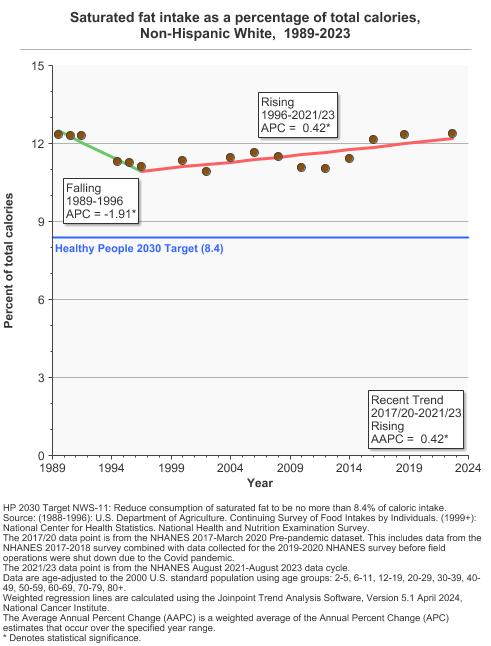
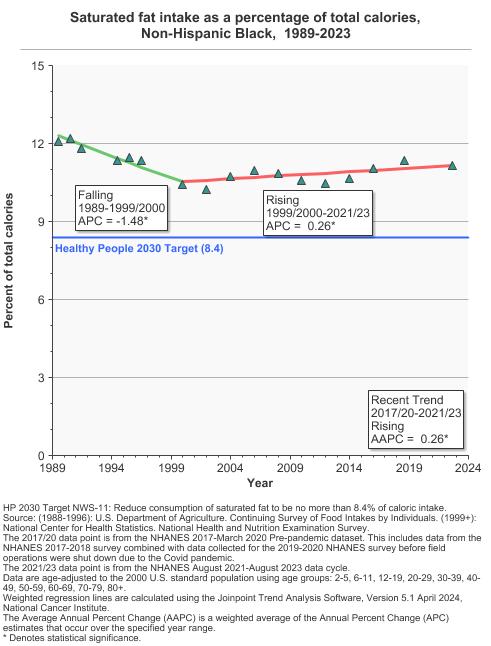
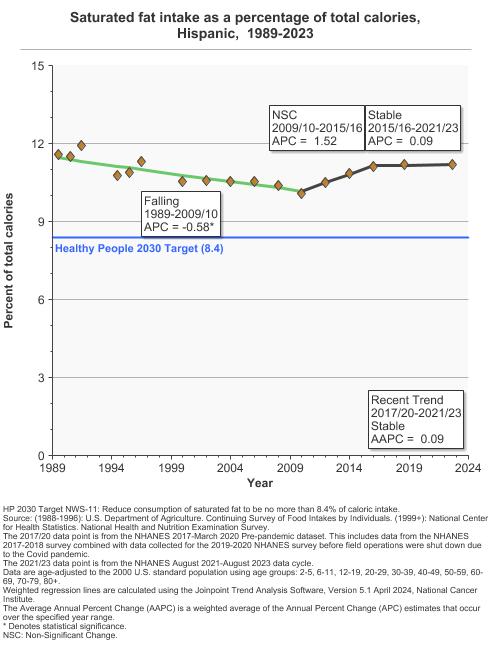
Saturated fat intake as a percentage of total calories by race/ethnicity, 1989-2023 Overview Graph Detailed Trend Graphs Most Recent Estimates (2021 to 2023) Percent of total calories 95% Confidence Interval 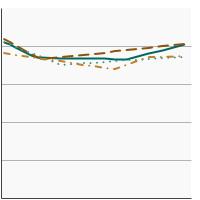
All Races/Ethnicities 11.9 11.7 - 12.2 Non-Hispanic White 12.4 12.1 - 12.7 Non-Hispanic Black 11.1 10.8 - 11.5 Hispanic 11.2 10.8 - 11.6 The 2021 to 2023 data point is from the NHANES August 2021-August 2023 data cycle. - By Poverty Income Level
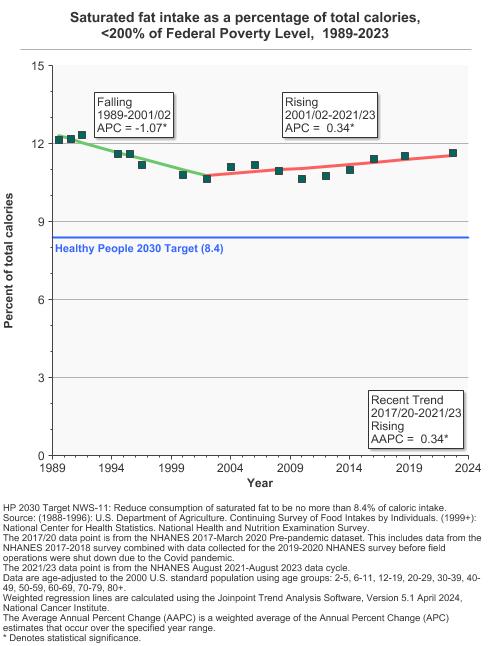
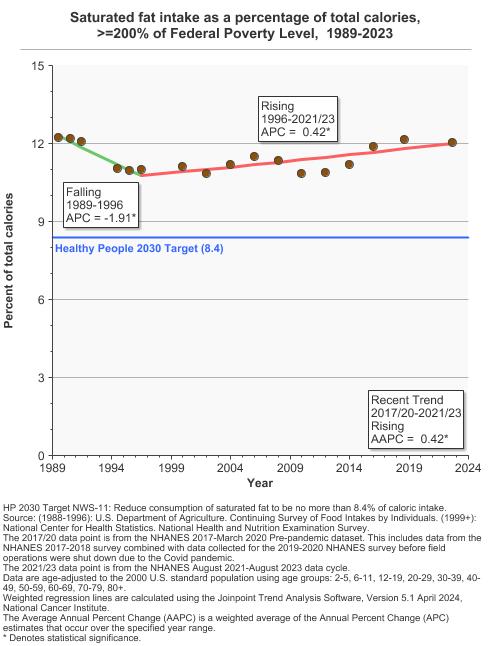
Saturated fat intake as a percentage of total calories by poverty income level, 1989-2023 Overview Graph Detailed Trend Graphs Most Recent Estimates (2021 to 2023) Percent of total calories 95% Confidence Interval 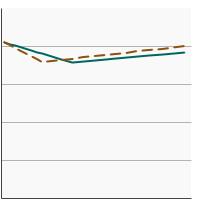
<200% of Federal Poverty Level 11.6 11.3 - 11.9 >=200% of Federal Poverty Level 12.0 11.7 - 12.3 The 2021 to 2023 data point is from the NHANES August 2021-August 2023 data cycle.
- Monosaturated Fat Intake
- By Sex
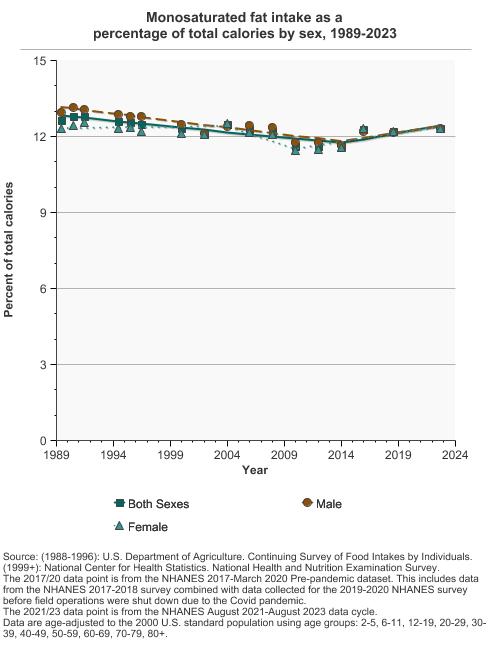
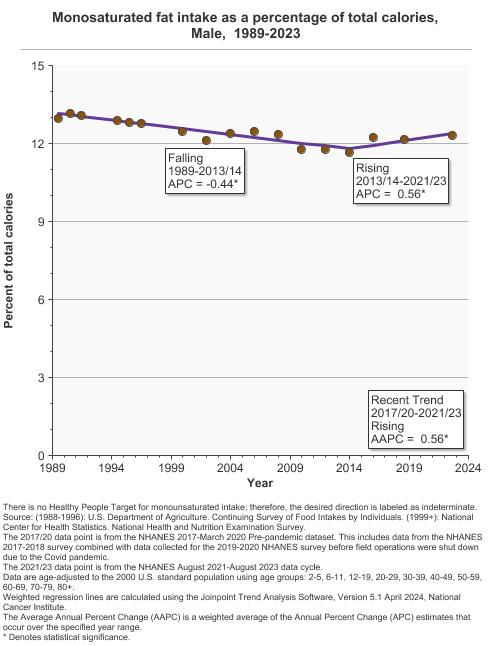
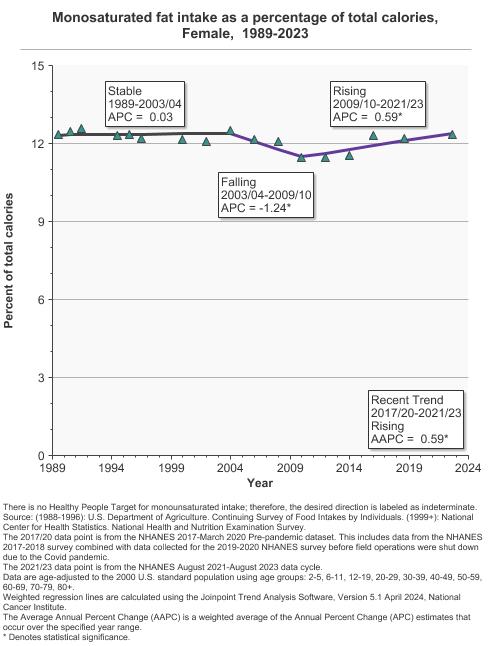
Monosaturated fat intake as a percentage of total calories by sex, 1989-2023 Overview Graph Detailed Trend Graphs Most Recent Estimates (2021 to 2023) Percent of total calories 95% Confidence Interval 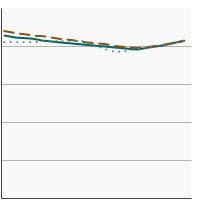
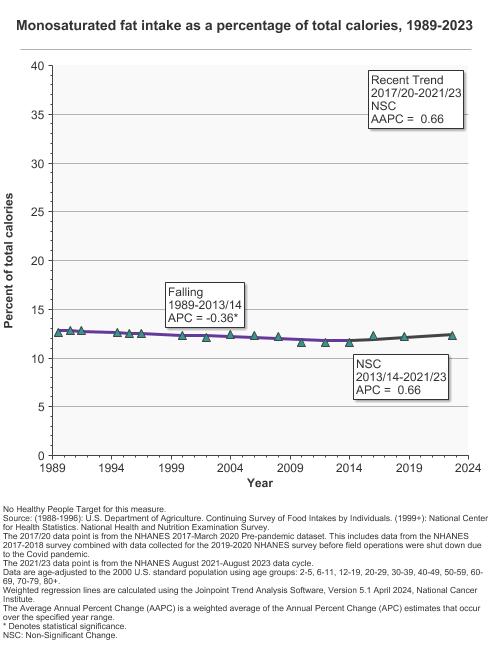
Both Sexes 12.3 12.2 - 12.5 Male 12.3 12.1 - 12.5 Female 12.3 12.1 - 12.6 The 2021 to 2023 data point is from the NHANES August 2021-August 2023 data cycle. - By Race/Ethnicity
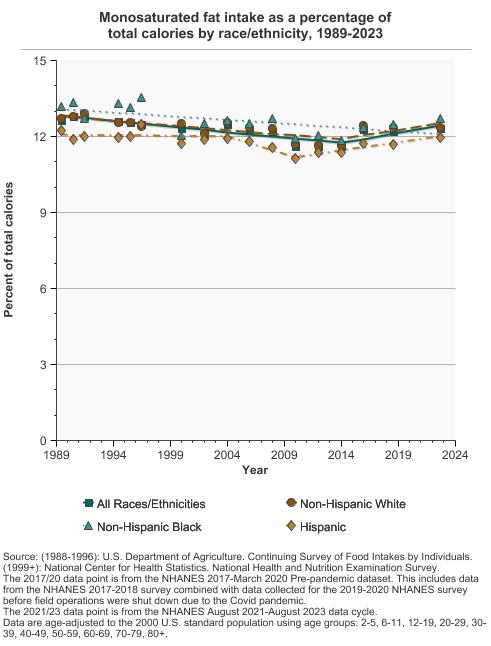
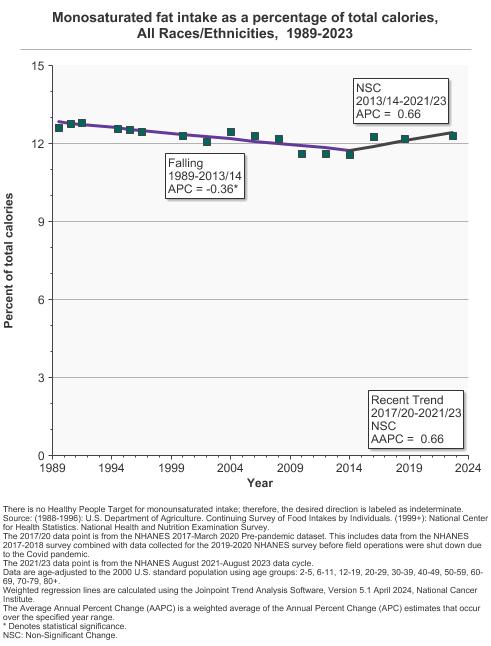
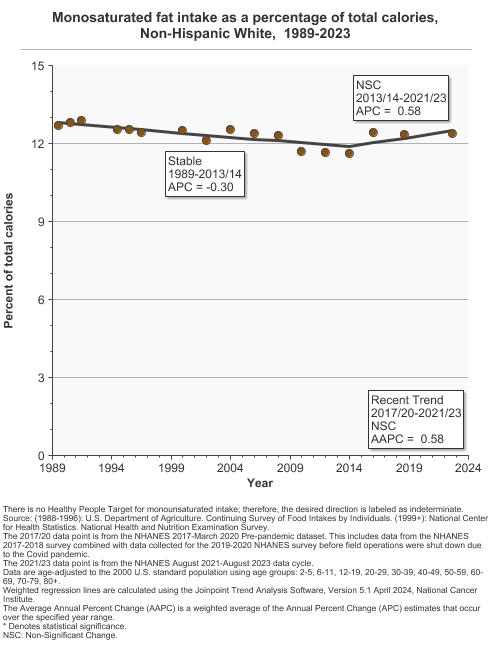
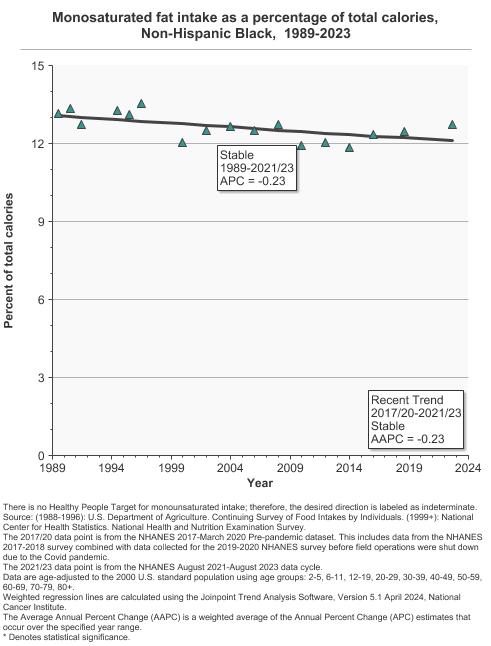
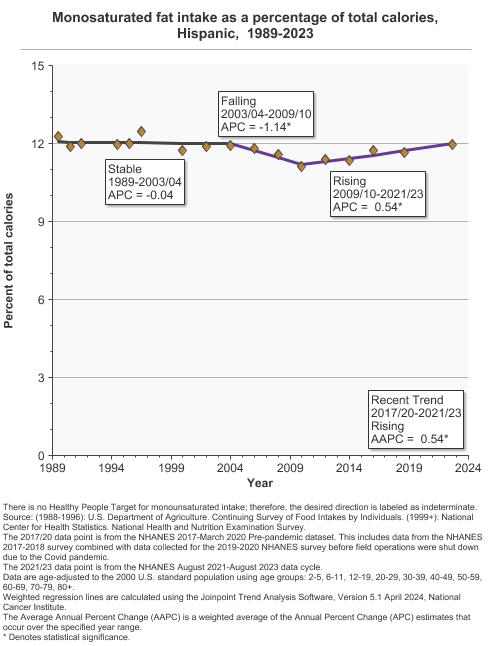
Monosaturated fat intake as a percentage of total calories by race/ethnicity, 1989-2023 Overview Graph Detailed Trend Graphs Most Recent Estimates (2021 to 2023) Percent of total calories 95% Confidence Interval 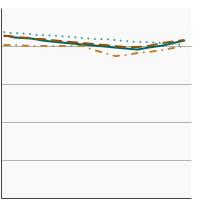
All Races/Ethnicities 12.3 12.2 - 12.5 Non-Hispanic White 12.4 12.2 - 12.6 Non-Hispanic Black 12.7 12.2 - 13.3 Hispanic 12.0 11.6 - 12.3 The 2021 to 2023 data point is from the NHANES August 2021-August 2023 data cycle. - By Poverty Income Level
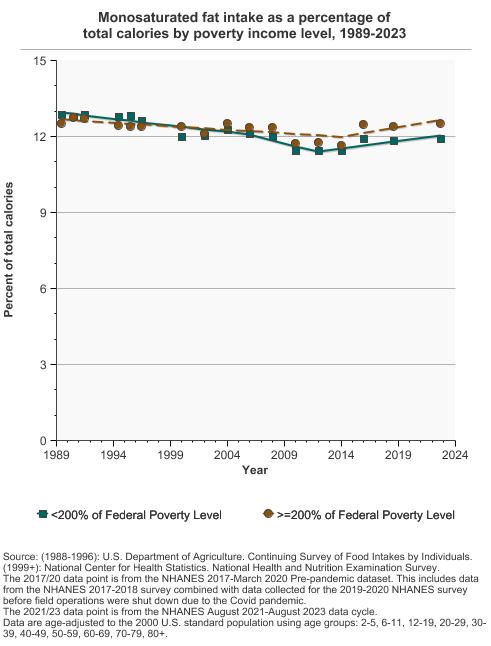
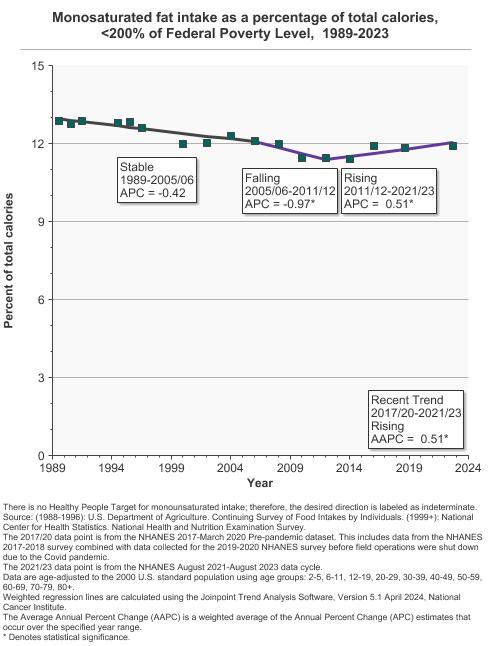
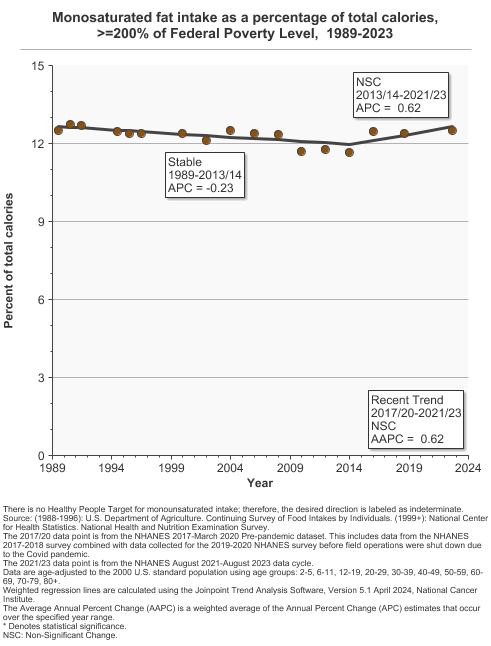
Monosaturated fat intake as a percentage of total calories by poverty income level, 1989-2023 Overview Graph Detailed Trend Graphs Most Recent Estimates (2021 to 2023) Percent of total calories 95% Confidence Interval 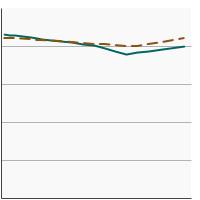
<200% of Federal Poverty Level 11.9 11.7 - 12.1 >=200% of Federal Poverty Level 12.5 12.3 - 12.7 The 2021 to 2023 data point is from the NHANES August 2021-August 2023 data cycle.
- Polyunsaturated Fat Intake
- By Sex
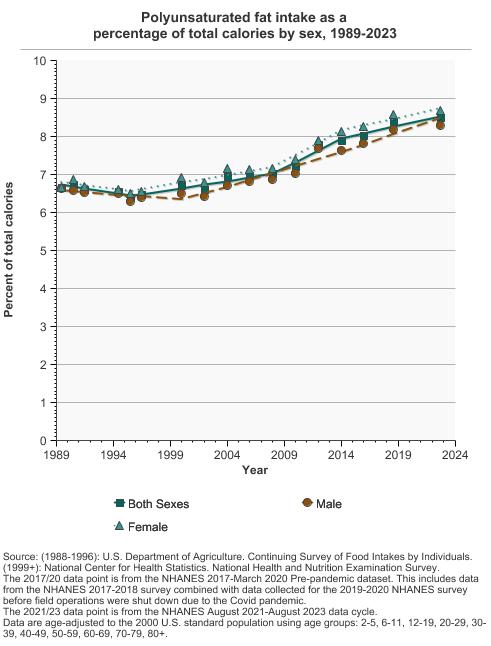
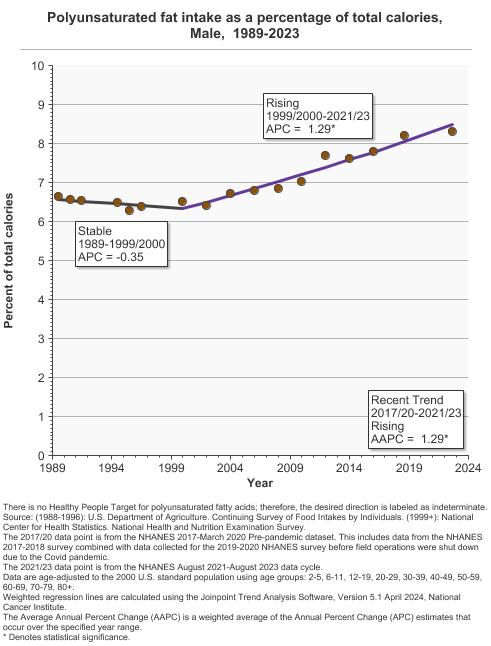
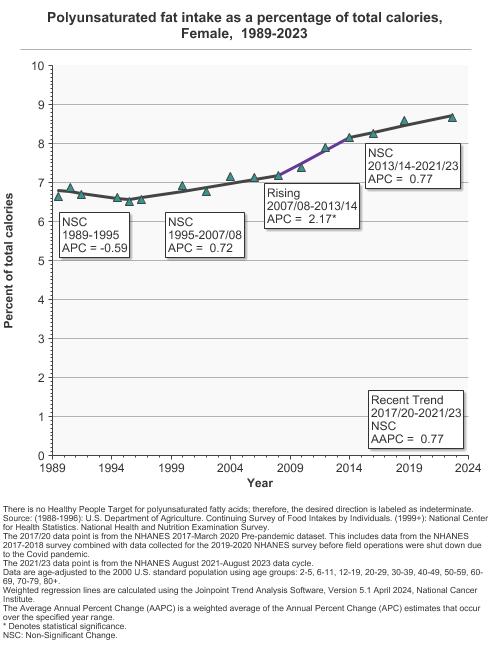
Polyunsaturated fat intake as a percentage of total calories by sex, 1989-2023 Overview Graph Detailed Trend Graphs Most Recent Estimates (2021 to 2023) Percent of total calories 95% Confidence Interval 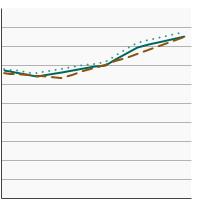
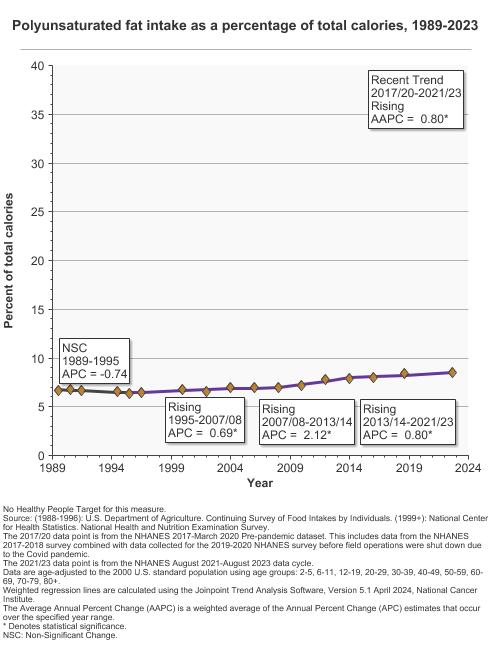
Both Sexes 8.5 8.3 - 8.6 Male 8.3 8.1 - 8.5 Female 8.7 8.5 - 8.9 The 2021 to 2023 data point is from the NHANES August 2021-August 2023 data cycle. - By Race/Ethnicity
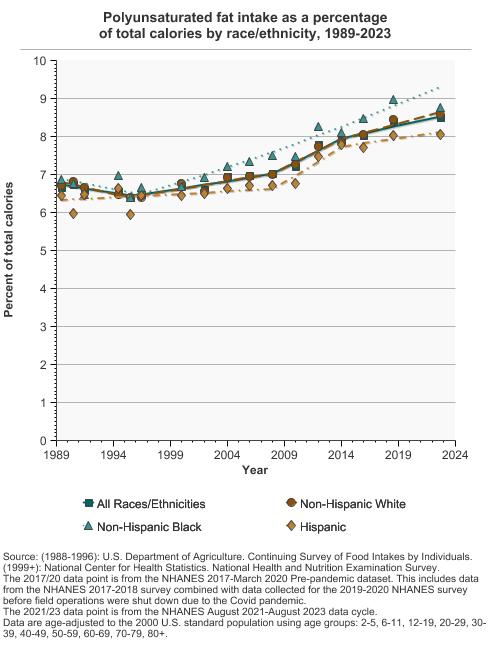
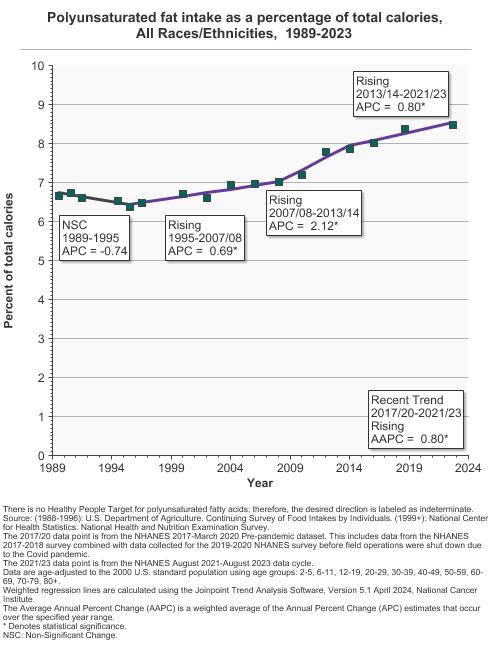
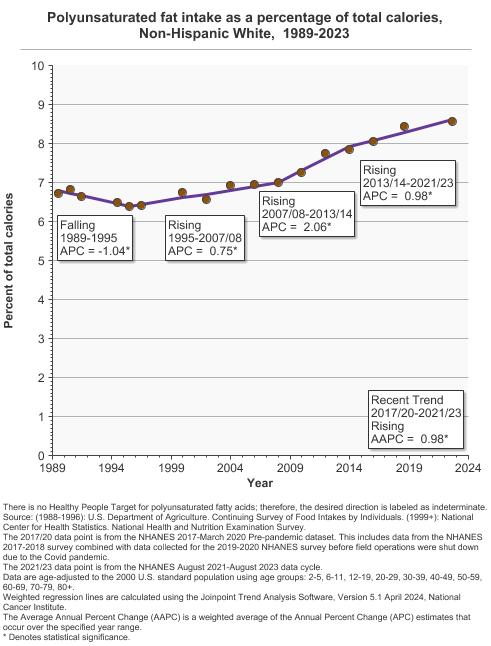
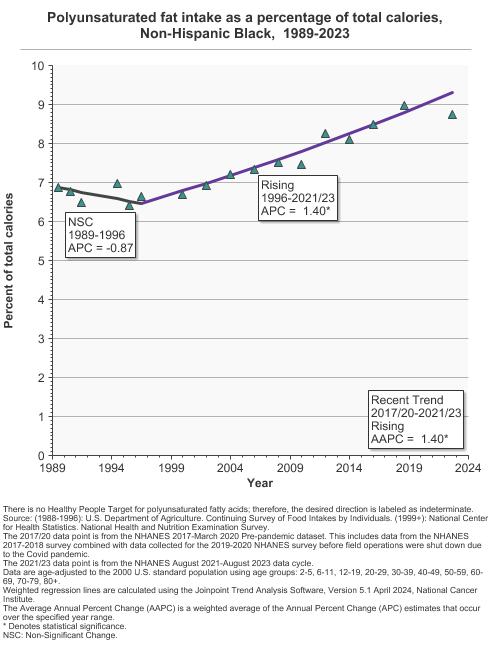
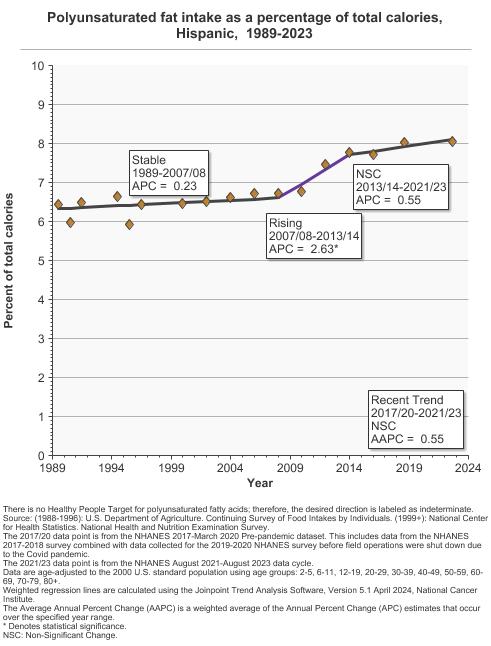
Polyunsaturated fat intake as a percentage of total calories by race/ethnicity, 1989-2023 Overview Graph Detailed Trend Graphs Most Recent Estimates (2021 to 2023) Percent of total calories 95% Confidence Interval 
All Races/Ethnicities 8.5 8.3 - 8.6 Non-Hispanic White 8.6 8.3 - 8.8 Non-Hispanic Black 8.8 8.4 - 9.1 Hispanic 8.0 7.8 - 8.3 The 2021 to 2023 data point is from the NHANES August 2021-August 2023 data cycle. - By Poverty Income Level
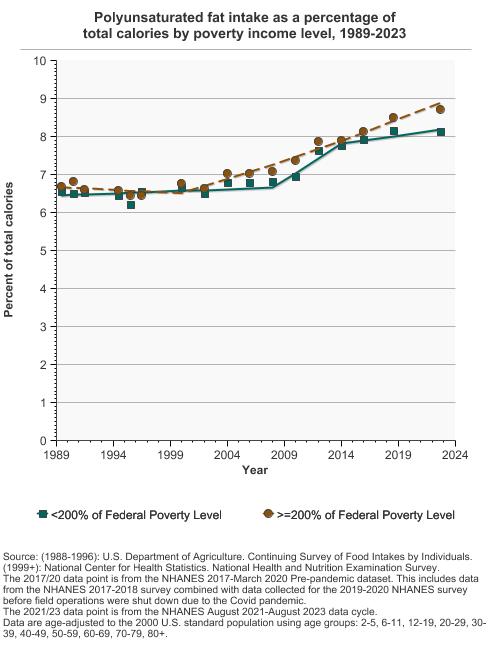
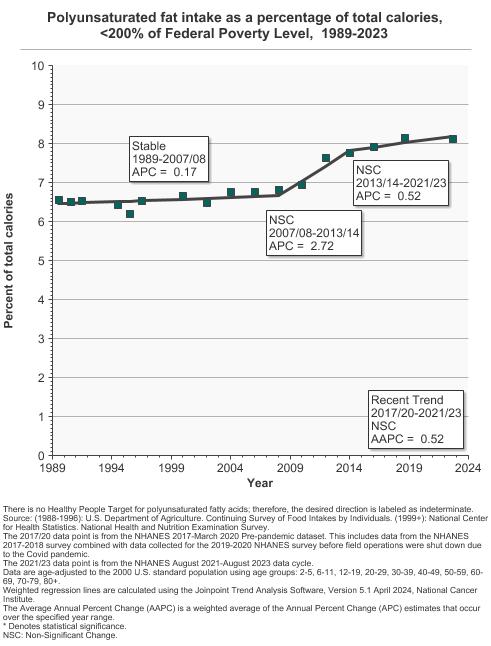
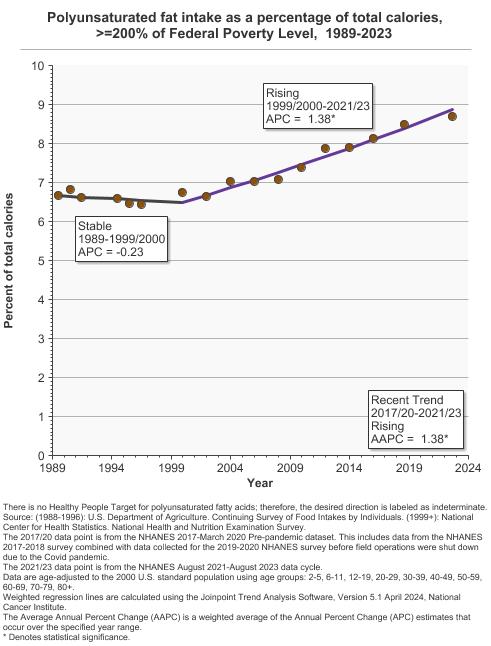
Polyunsaturated fat intake as a percentage of total calories by poverty income level, 1989-2023 Overview Graph Detailed Trend Graphs Most Recent Estimates (2021 to 2023) Percent of total calories 95% Confidence Interval 
<200% of Federal Poverty Level 8.1 8.0 - 8.3 >=200% of Federal Poverty Level 8.7 8.5 - 8.9 The 2021 to 2023 data point is from the NHANES August 2021-August 2023 data cycle.


Additional Information
- Chartbook on Healthy Living. Agency for Healthcare Research and Quality.
- ACS Guideline on Nutrition and Physical Activity for Cancer Prevention. American Cancer Society.
- Diet and Physical Activity: What’s the Cancer Connection? American Cancer Society.
- Cancer Prevention and Control: Healthy Choices. Centers for Disease Control and Prevention.
- Nutrition, Physical Activity, and Obesity. Centers for Disease Control and Prevention.
- Diet/Nutrition Evidence-Based Programs Listing. National Cancer Institute.
- Nutrition, Physical Activity, and Obesity. Centers for Disease Control and Prevention. State, Tribal, Local, and Territorial Public Health Professionals Gateway.
- 2020-2025 Dietary Guidelines for Americans. U.S. Department of Agriculture and U.S. Department of Health and Human Services.
- Global Cancer Update Programme. World Cancer Research Fund International.
- Diet, Nutrition, Physical Activity, and Cancer: a Global Perspective. World Cancer Research Fund and the American Institute for Cancer Research.
- Diet, nutrition and the prevention of chronic diseases. World Health Organization.
- American Cancer Society guideline for diet and physical activity for cancer prevention. Rock CL, Thomson C, Gansler T, et al. CA Cancer J Clin. 2020; 70(4): 245-271.
- Usual Dietary Intakes: Food Intakes, U.S. Population, 2007–10. National Cancer Institute.
- What We Eat in America. U.S. Department of Agriculture.