On This Page:
- Background
- Measure
- Healthy People 2030 Target
- Data Source
- Trends and Most Recent Estimates
- Related Cancers
- Additional Information
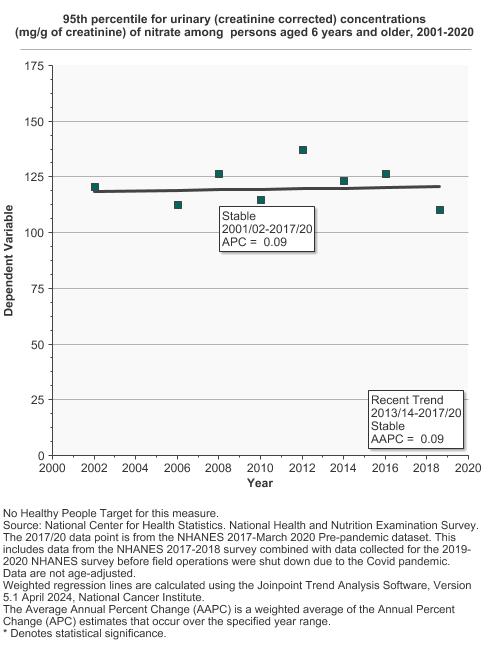
From 2017 to 2020, the 95th percentile for urinary (creatinine corrected) concentration of nitrate among persons aged 6 years and older was 110.3 mg/g of creatinine.
Background
Nitrates and nitrites are nitrogen-oxygen chemical units that naturally occur in soil, water, and some foods. When taken into the body by drinking water and through other dietary sources, nitrate and nitrite can react with amines and amides to form N-nitroso compounds (NOCs), which are known to cause cancer in animals and may cause cancer in humans. Excessive nitrate or nitrite exposure can also result in acute acquired methemoglobinemia, a blood abnormality that causes blood to lose its ability to carry oxygen to tissues (anoxia). This is especially dangerous in infants younger than 4 months of age.
The biggest source of nitrate exposure is dietary consumption of certain types of vegetables that are naturally high in nitrate, especially green, leafy, and root vegetables (although processed meats can also contain high levels of nitrite). However, many vegetables also contain compounds, such as vitamin C and other antioxidants, that can inhibit the formation of NOCs. Studies assessing connections between nitrate and cancer in humans have focused on excess exposure from drinking water or food grown in areas where use of nitrogen-based fertilizers is common. Some of the highest levels of nitrate have been measured in shallow wells and surface water supplies that are subject to runoff from nitrogen fertilizers, confined animal feedlot operations, and resulting excrement and contamination from leaking septic tanks and sewage. In addition, workers who manufacture these fertilizers can have high exposures to dusts that contain nitrate. Oral tobacco also may contribute to nitrate intake, but is a minor source compared to diet or contaminated drinking water.
Studies have shown increased risks of colon, kidney, and stomach cancer among people with higher ingestion of water nitrate and higher meat intake compared with low intakes of both, a dietary pattern that results in increased NOC formation. Other studies have shown modest evidence that higher nitrate intake can increase the risk of thyroid cancer and ovarian cancer among women.
Measure
We present exposure data on the 95th percentile of the population, representing people with the greatest exposure. The 95th percentile level means that 95% of the population has concentrations below that level. Public health officials use such reference values to determine whether groups of people are experiencing an exposure that is unusual compared with an exposure experienced by the rest of the population. For more information, see the National Report on Human Exposure to Environmental Chemicals, published by the Centers for Disease Control and Prevention.
To calculate whether the differences between 95th percentiles for two different time points is statistically significant, we used a different statistical methodology than that used by the National Center for Environmental Health, which publishes the National Report on Human Exposure to Environmental Chemicals, from which our data are derived. Our estimates may differ slightly from those in the original report due to differences in statistical procedures used. [Methodology]
As nitrate is measured from urine, the concentration of nitrate may be affected by urine diluteness. Analyte concentrations within urine also may vary with time due to changes in the water concentration within urine. We use creatinine as a reference analyte to adjust for urine concentration and obtain measures of nitrate that are comparable, whether they are from concentrated or dilute urine samples.
Data Source
Centers for Disease Control and Prevention, National Center for Health Statistics, National Health and Nutrition Examination Survey (NHANES).
The NHANES 2017-2018 data point was replaced with the NHANES 2017-March 2020 Pre-pandemic data point. More information is available at NHANES Questionnaires, Datasets, and Related Documentation.
Healthy People 2030 Target
There are no Healthy People 2030 targets regarding nitrate.
Healthy People 2030 is a set of goals set forth by the Department of Health and Human Services.
Trends and Most Recent Estimates
- By Sex
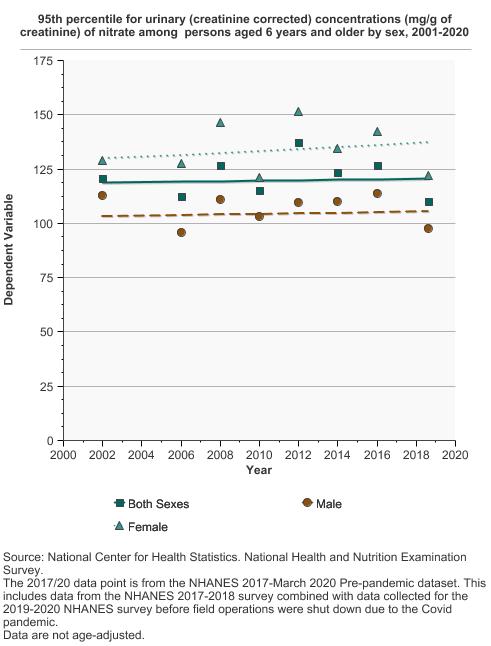
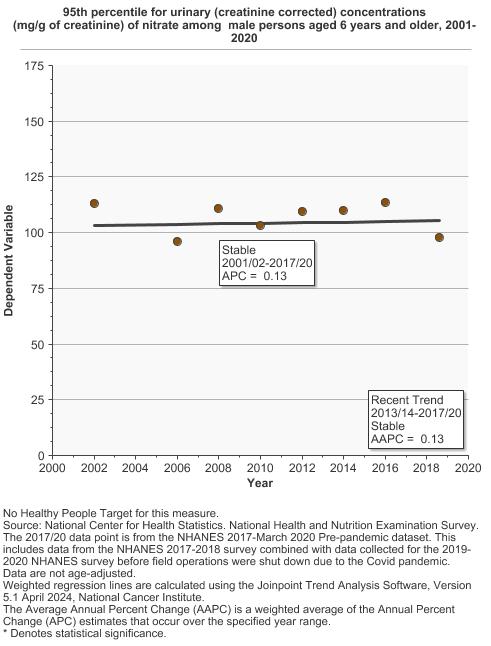
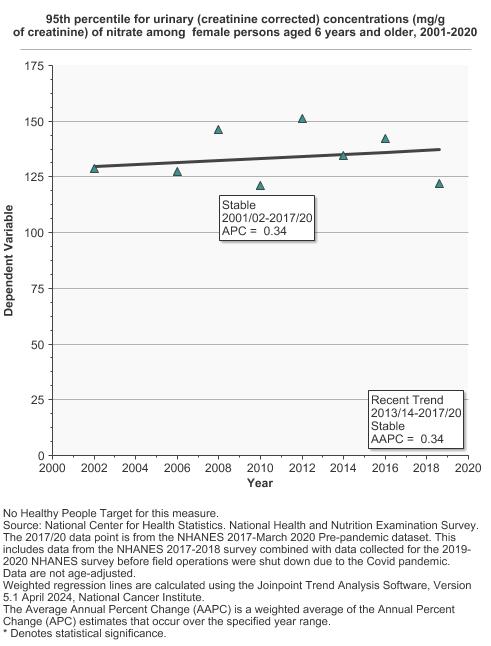
95th percentile for urinary (creatinine corrected) concentrations (mg/g of creatinine) of nitrate among persons aged 6 years and older by sex, 2001-2020 Overview Graph Detailed Trend Graphs Most Recent Estimates (2017 to 2020) Dependent Variable 95% Confidence Interval 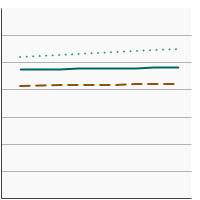

Both Sexes 
110.3 98.8 - 122.5 Male 97.7 85.1 - 110.6 Female 122.2 103.9 - 142.3 The 2017 to 2020 data point is from the NHANES 2017-March 2020 Pre-pandemic dataset. This includes data from the NHANES 2017-2018 survey combined with data collected for the 2019-2020 NHANES survey before field operations were shut down due to the Covid pandemic. - By Race/Ethnicity
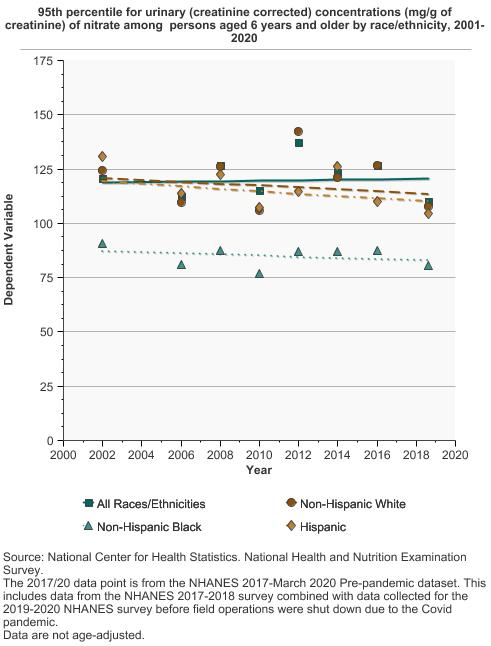
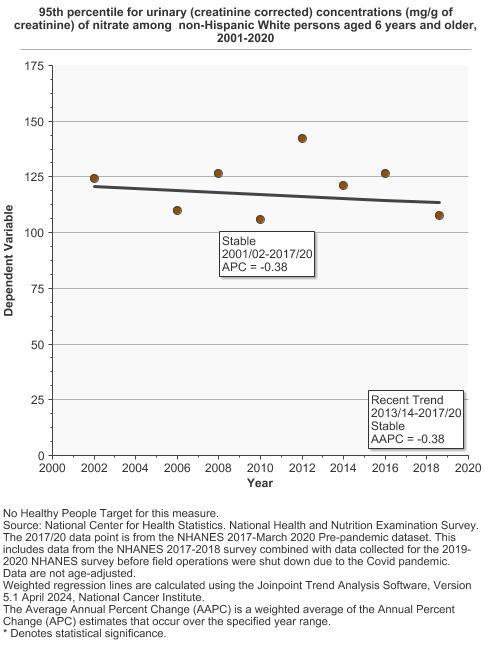
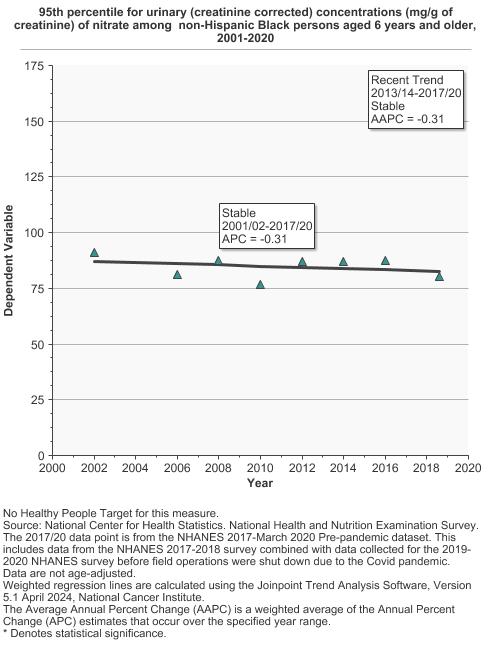
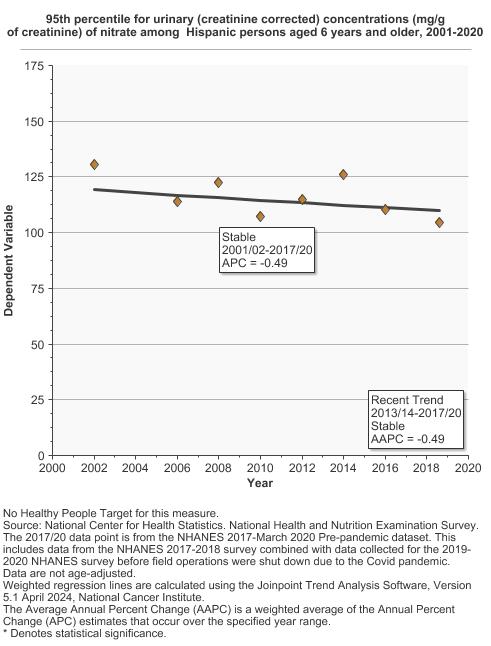
95th percentile for urinary (creatinine corrected) concentrations (mg/g of creatinine) of nitrate among persons aged 6 years and older by race/ethnicity, 2001-2020 Overview Graph Detailed Trend Graphs Most Recent Estimates (2017 to 2020) Dependent Variable 95% Confidence Interval 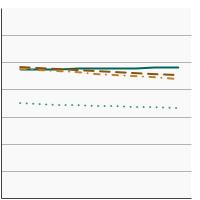
All Races/Ethnicities 110.3 98.8 - 122.5 Non-Hispanic White 107.8 97.4 - 121.9 Non-Hispanic Black 80.5 69.8 - 85.3 Hispanic 104.4 89.1 - 120.6 The 2017 to 2020 data point is from the NHANES 2017-March 2020 Pre-pandemic dataset. This includes data from the NHANES 2017-2018 survey combined with data collected for the 2019-2020 NHANES survey before field operations were shut down due to the Covid pandemic. - By Age
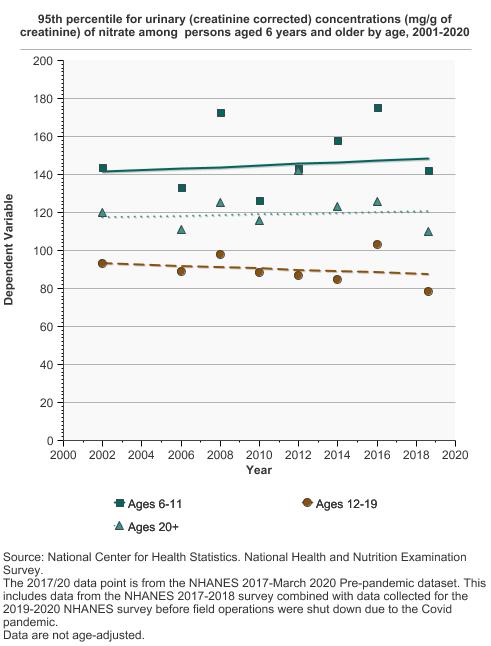
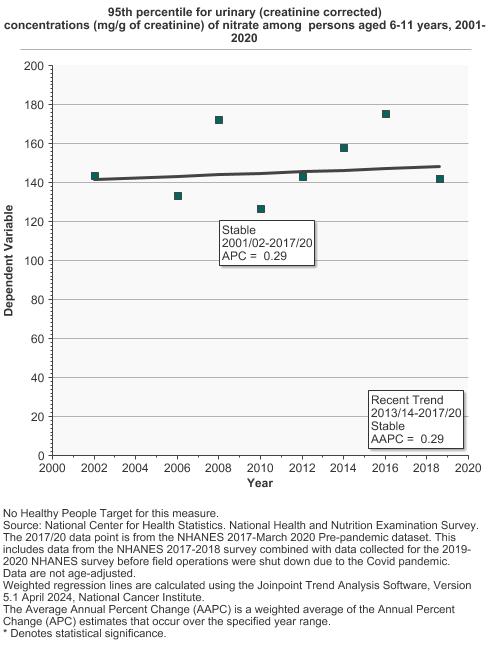
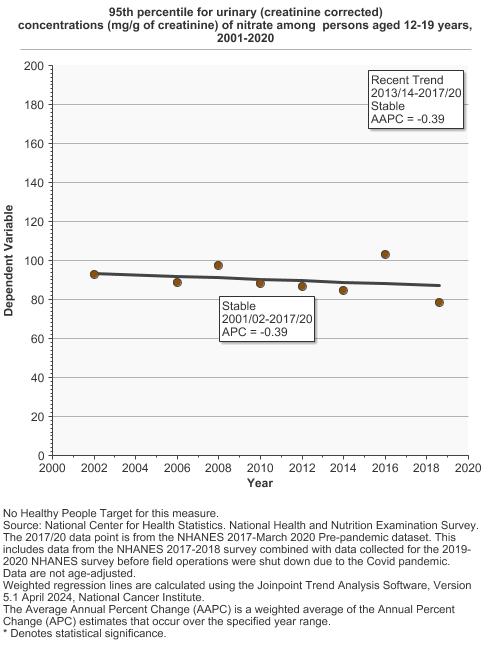
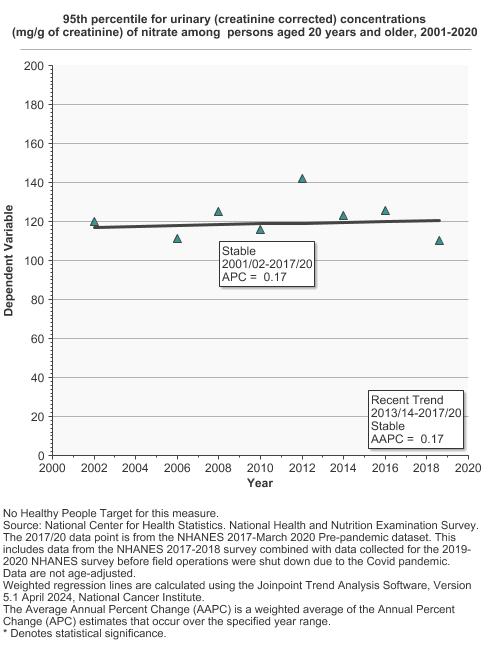
95th percentile for urinary (creatinine corrected) concentrations (mg/g of creatinine) of nitrate among persons aged 6 years and older by age, 2001-2020 Overview Graph Detailed Trend Graphs Most Recent Estimates (2017 to 2020) Dependent Variable 95% Confidence Interval 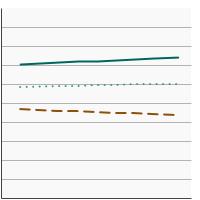
Ages 6-11 141.9 122.2 - 162.2 Ages 12-19 78.4 67.3 - 93.6 Ages 20+ 110.1 97.6 - 123.5 The 2017 to 2020 data point is from the NHANES 2017-March 2020 Pre-pandemic dataset. This includes data from the NHANES 2017-2018 survey combined with data collected for the 2019-2020 NHANES survey before field operations were shut down due to the Covid pandemic. - By Poverty Income Level
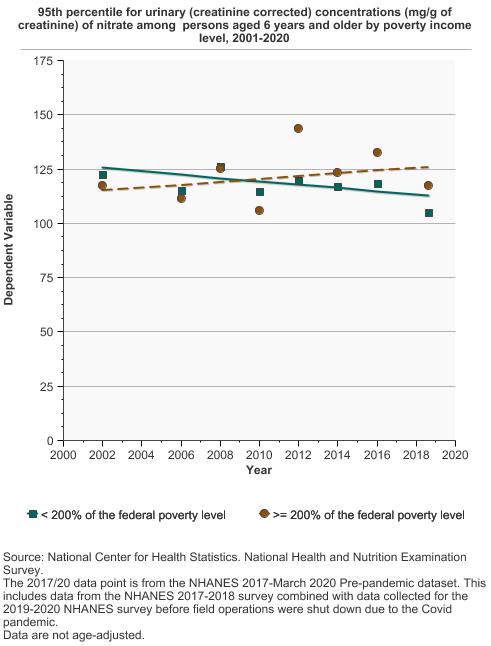
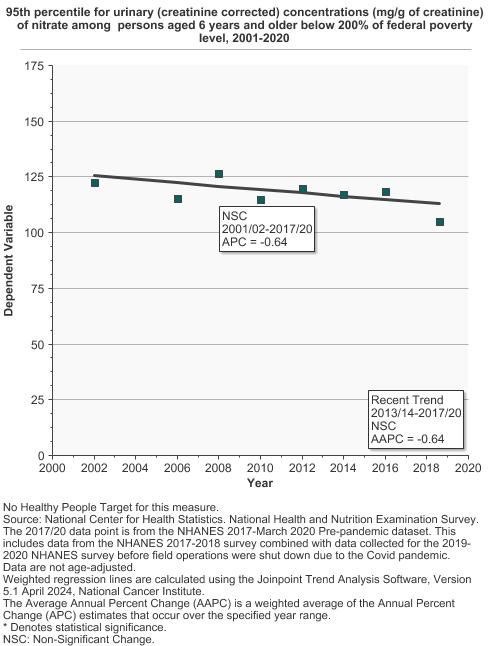
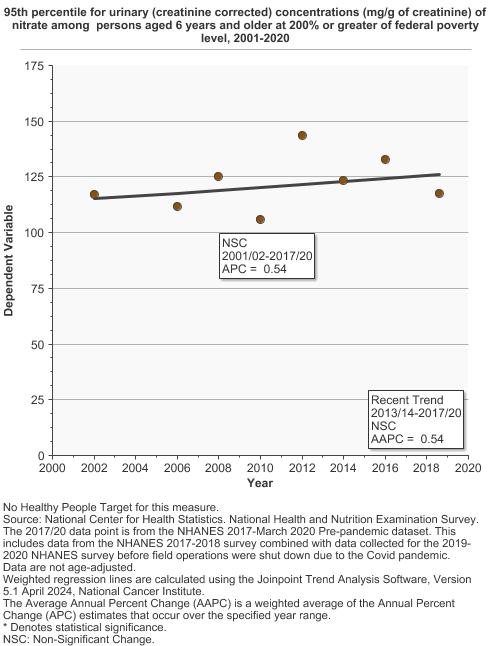
95th percentile for urinary (creatinine corrected) concentrations (mg/g of creatinine) of nitrate among persons aged 6 years and older by poverty income level, 2001-2020 Overview Graph Detailed Trend Graphs Most Recent Estimates (2017 to 2020) Dependent Variable 95% Confidence Interval 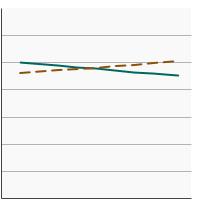
< 200% of the federal poverty level 105.1 91.6 - 119.4 >= 200% of the federal poverty level 117.6 100.4 - 130.7 The 2017 to 2020 data point is from the NHANES 2017-March 2020 Pre-pandemic dataset. This includes data from the NHANES 2017-2018 survey combined with data collected for the 2019-2020 NHANES survey before field operations were shut down due to the Covid pandemic. - By Education Level
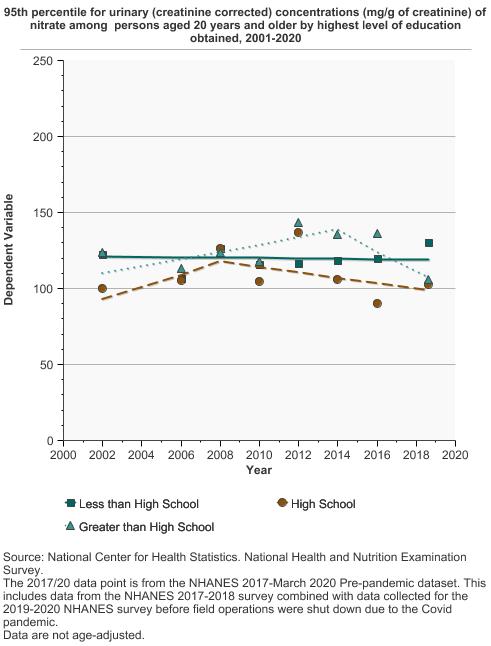
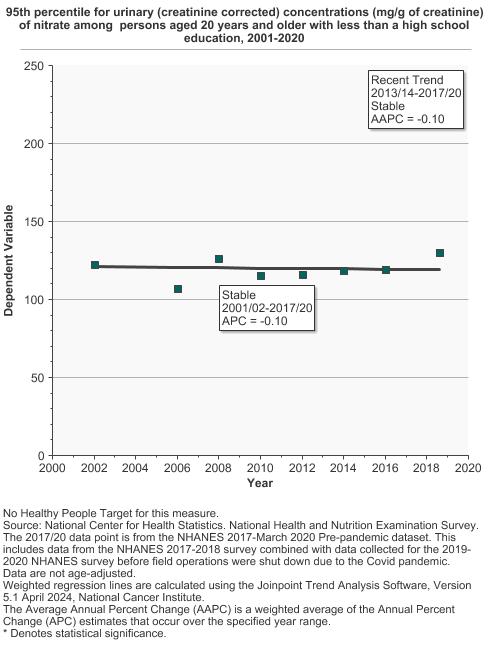
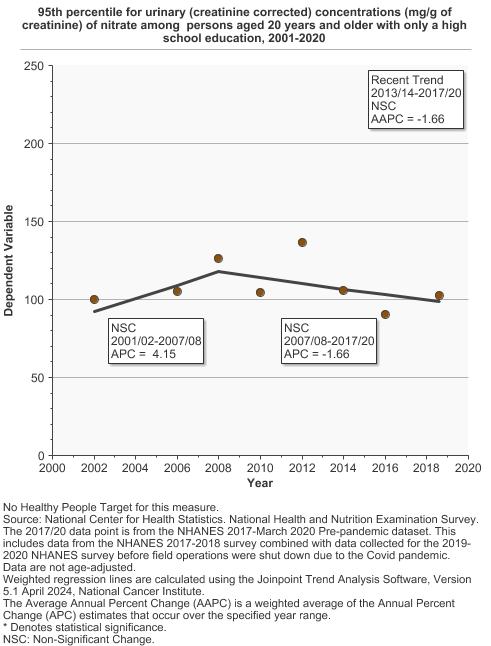
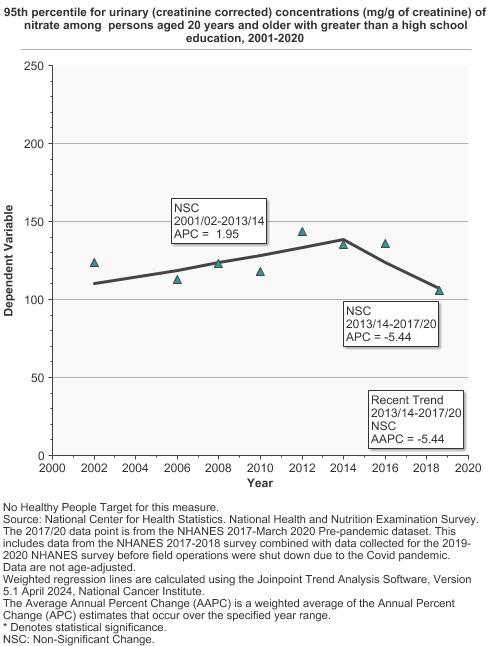
95th percentile for urinary (creatinine corrected) concentrations (mg/g of creatinine) of nitrate among persons aged 20 years and older by highest level of education obtained, 2001-2020 Overview Graph Detailed Trend Graphs Most Recent Estimates (2017 to 2020) Dependent Variable 95% Confidence Interval 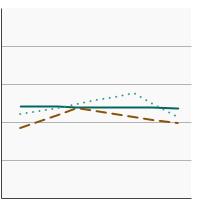
Less than High School 130.0 85.0 - 251.2 High School 102.3 83.3 - 123.0 Greater than High School 105.8 97.1 - 118.8 The 2017 to 2020 data point is from the NHANES 2017-March 2020 Pre-pandemic dataset. This includes data from the NHANES 2017-2018 survey combined with data collected for the 2019-2020 NHANES survey before field operations were shut down due to the Covid pandemic.

Additional Information
- Toxic Substances Portal – Nitrate and Nitrite: ToxFAQs™ for Nitrate and Nitrite. Agency for Toxic Substances & Disease Registry.
- Stomach Cancer Risk Factors. American Cancer Society.
- Fourth National Report on Human Exposure to Environmental Chemicals: Updated Tables, March 2018, Volume One. Centers for Disease Control and Prevention.
- Fourth National Report on Human Exposure to Environmental Chemicals: Updated Tables, March 2018, Volume Two. Centers for Disease Control and Prevention.
- Drinking Water Requirements for States and Public Water Systems: Chemical Contaminant Rules. Environmental Protection Agency.
- ATSDR Case Studies in Environmental Medicine Nitrate/Nitrite Toxicity. Agency for Toxic Substances and Disease Registry.
- Nitrate. Environmental Protection Agency, Integrated Risk Information System.
- Pancreatic cancer and exposure to dietary nitrate and nitrite in the NIH-AARP Diet and Health Study. Aschebrook-Kilfoy B, Cross AJ, Stolzenberg-Solomon RZ, et al. Am J Epidemiol. 2011;174(3):305–15.
- Thyroid cancer risk and dietary nitrate and nitrite intake in the Shanghai women’s health study. Aschebrook-Kilfoy B, Shu XO, Gao YT, et al. Int J Cancer 2013:132(4):897–904.
- Epithelial ovarian cancer and exposure to dietary nitrate and nitrite in the NIH-AARP Diet and Health Study. Aschebrook-Kilfoy B, Ward MH, Gierach GL, et al. Eur J Cancer Prev. 2012;21(1):65–72.
- Pancreatic cancer and drinking water and dietary sources of nitrate and nitrite. Coss A, Cantor KP, Reif JS, et al. Am J Epidemiol. 2004;159(7):693–701.
- Nitrate in public water supplies and risk of colon and rectum cancers. De Roos A, Ward MH, Lynch C, and Cantor KP. Epidemiology 2003;14(6):640–9.
- Carcinogenicity of nitrate, nitrite, and cyanobacterial peptide toxins. Grosse Y, Baan R, Straif K, et al. Lancet Oncol. 2006;7(8):628–9.
- Dietary intake of polyphenols, nitrate and nitrite and gastric cancer risk in Mexico City. Hernandez-Ramirez RU, Galvan-Portillo MV, Ward MH, et al. Int J Cancer 2009;125(6):1424–30.
- Ingested Nitrate and Nitrite, and Cyanobacterial Peptide Toxins. International Agency for Research on Cancer. IARC Monographs on the Evaluation of Carcinogenic Risks to Humans 2010;94.
- Drinking water nitrate and human health: an updated review. Ward MH, Jones RR, Brender JD et al. Int J Environ Res Public Health 2018;15(7): pii:E1557.
- Nitrate in public water supplies and the risk of renal cell carcinoma. Ward MH, Rusiecki J, Lynch CF, Cantor KP. Cancer Causes Control 2007 Dec;18(10):1141–51.