On This Page:
- Background
- Measure
- Healthy People 2030 Target
- Data Source
- Trends and Most Recent Estimates
- Related Cancers
- Additional Information
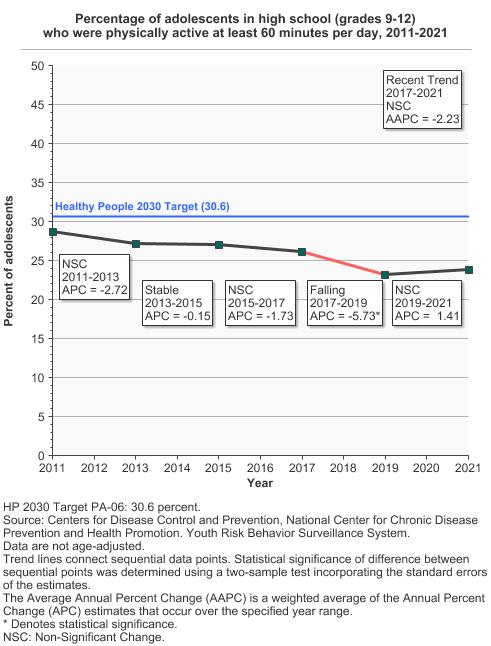
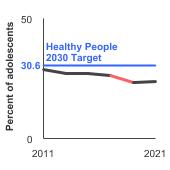
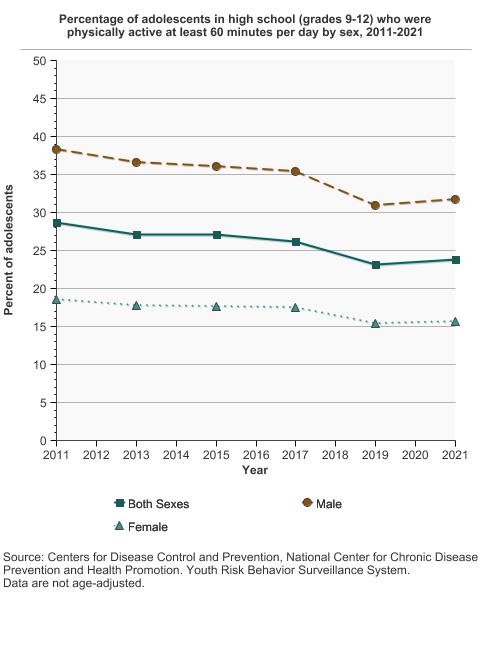
In 2021, 23.9% of adolescents in grades 9-12 were physically active at least 60 minutes per day.
Background
Regular physical activity is fundamental for the growth, health, and well-being of children and adolescents. The importance of incorporating physical activity into the daily lives of young people is underscored by its long-term health benefits. Inactive children are at a greater risk of developing chronic conditions such as obesity, cardiovascular diseases, and type 2 diabetes in the future. Moreover, current studies indicate that insufficient physical activity in the early years may be linked to an increased risk of certain types of cancer in adulthood. Regular physical activity in children helps to regulate hormones, boost the immune system, and maintain a healthy weight—each a vital component in minimizing cancer risks.
For childhood cancer survivors, the role of physical activity is equally important. Consistent evidence shows that exercise contributes significantly to improved physical and emotional well-being, reduced fatigue, and enhanced overall health outcomes in childhood.
Several groups offer recommendations for physical activity in children and adolescents. The U.S. Department of Health and Human Services recommends that children ages 3-17 years old engage in at least 60 minutes of moderate-to-vigorous physical activity daily. As part of the 60 minutes or more of daily activity, children and adolescents should also include muscle-strengthening physical activity on at least 3 days a week.
Measure
Percentage of children ages 6-13 who participated in physical activity for at least 60 minutes every day during the past week.
Percentage of adolescents in grades 9 through 12 who reported engaging in physical activity for at least 60 minutes on all days of the past week.
Percentage of adolescents in grades 9 through 12 who participated in muscle-strengthening activity on 3 or more days of the past week.
Data Source
Childhood: Health Resources and Services Administration (HRSA) Maternal and Child Health Bureau (MCHB), National Survey of Children's Health (NSCH), 2016-2022.
Adolescents: Centers for Disease Control and Prevention, Youth Risk Behavior Surveillance System, 1991-2021.
Healthy People 2030 Target
- Increase the proportion of children who meet the current guideline for aerobic physical activity to 30.4 percent.
- Increase the proportion of adolescents in grades 9 through 12 who meet the current guideline for aerobic physical activity to 30.6 percent.
- Increase the proportion of adolescents in grades 9 through 12 who meet the current muscle-strengthening activity guideline to 56.1 percent.
Healthy People 2030 is a set of goals set forth by the Department of Health and Human Services.
Note: Goals are indicated as blue line on Detailed Trend Graphs.
Trends and Most Recent Estimates
- Children (Ages 6 to 13), Aerobic Physical Activity
- By Sex
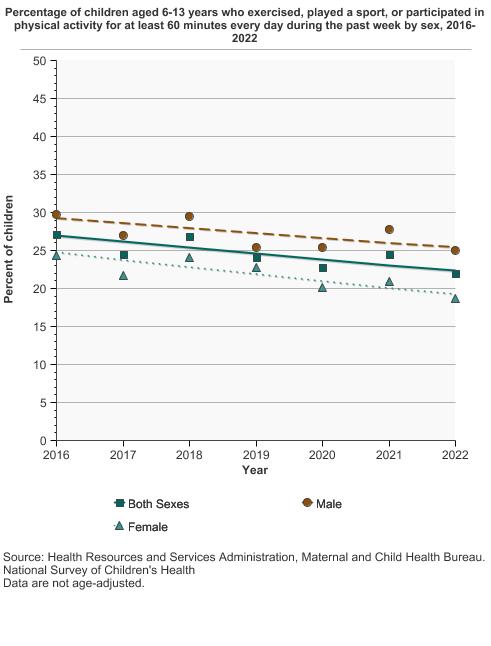
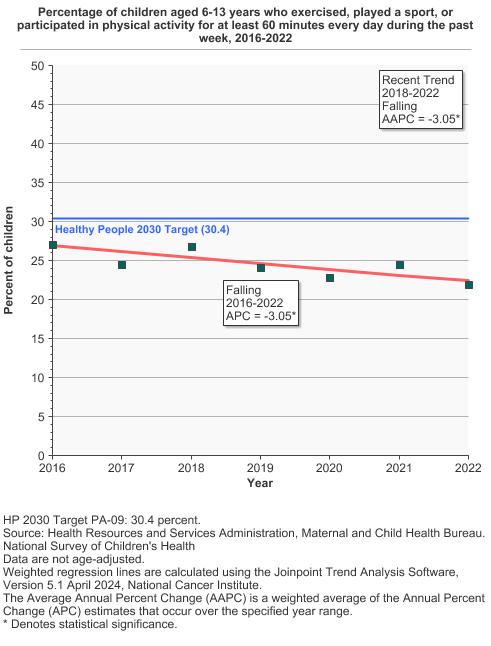
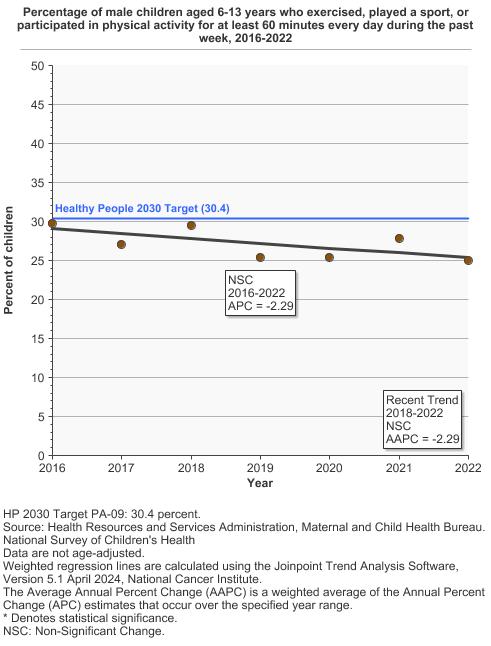
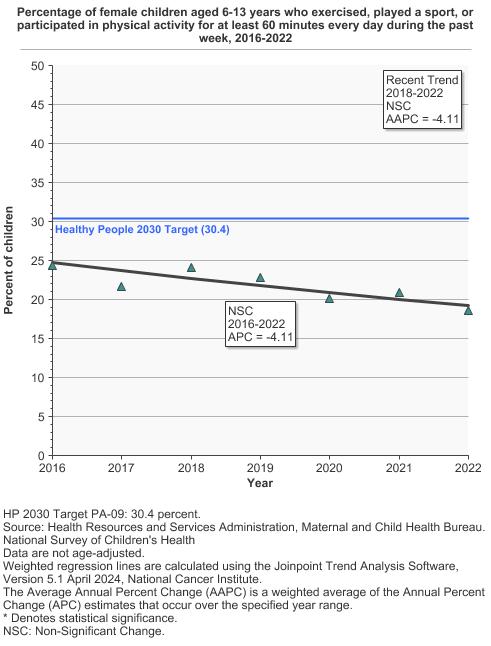
Percentage of children aged 6-13 years who exercised, played a sport, or participated in physical activity for at least 60 minutes every day during the past week by sex, 2016-2022 Overview Graph Detailed Trend Graphs Most Recent Estimates (2022) Percent of children 95% Confidence Interval 

Both Sexes 
21.9 20.9 - 23.0 Male 25.1 23.5 - 26.7 Female 18.6 17.3 - 20.0 - By Race/Ethnicity
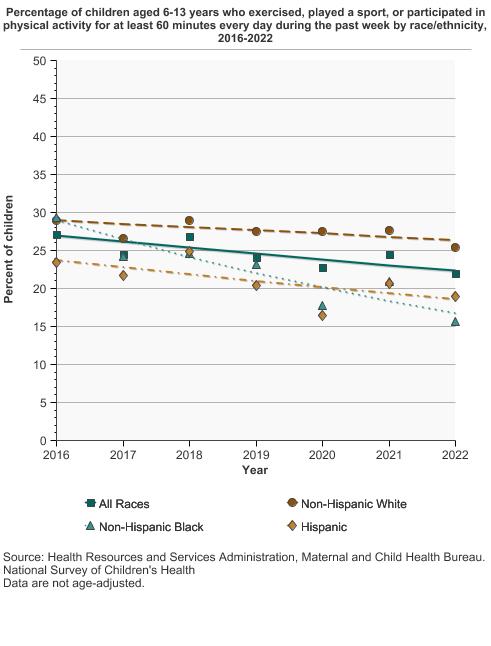
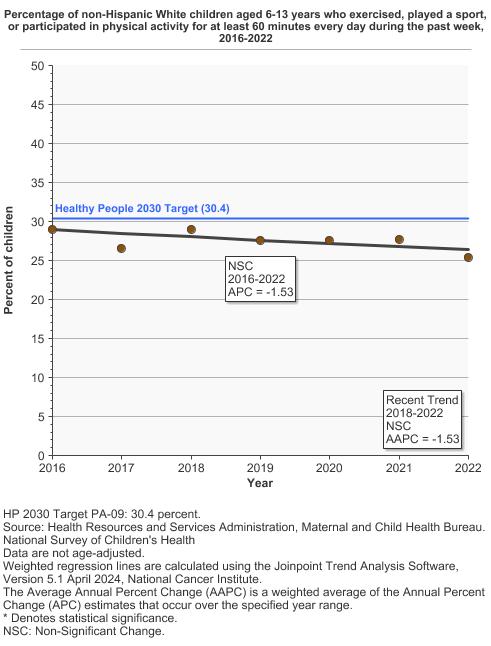
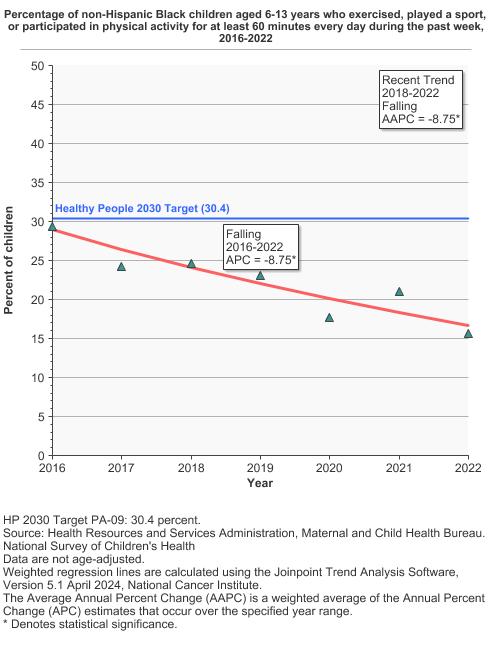
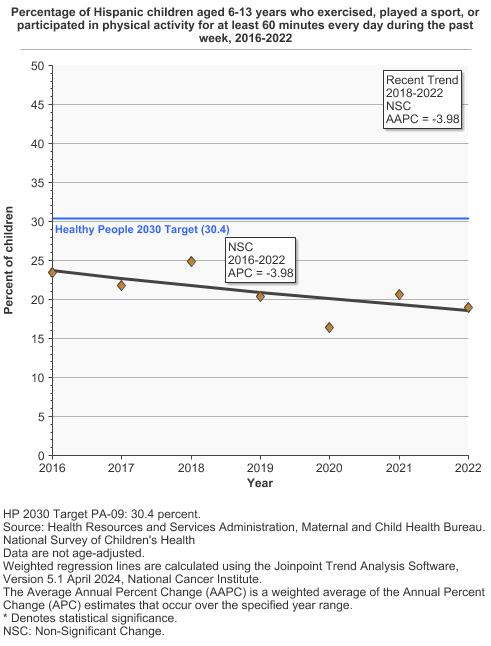
Percentage of children aged 6-13 years who exercised, played a sport, or participated in physical activity for at least 60 minutes every day during the past week by race/ethnicity, 2016-2022 Overview Graph Detailed Trend Graphs Most Recent Estimates (2022) Percent of children 95% Confidence Interval 
All Races 21.9 20.9 - 23.0 Non-Hispanic White 25.3 24.0 - 26.7 Non-Hispanic Black 15.7 13.1 - 18.7 Hispanic 19.0 16.6 - 21.5 - By Age
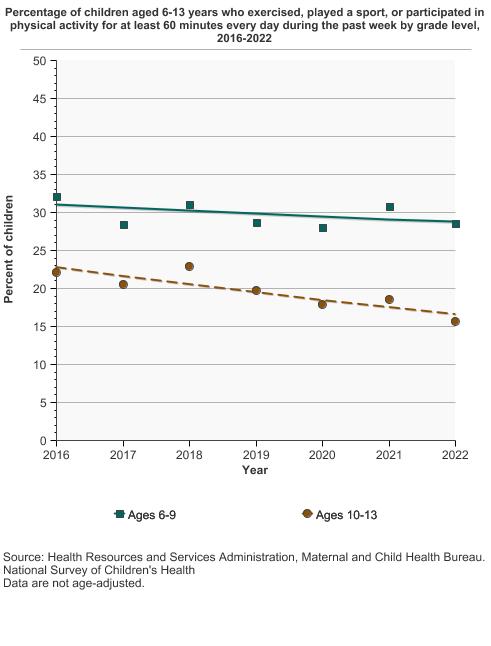
Percentage of children aged 6-13 years who exercised, played a sport, or participated in physical activity for at least 60 minutes every day during the past week by age, 2016-2022 Overview Graph Detailed Trend Graphs Most Recent Estimates (2022) Percent of children 95% Confidence Interval 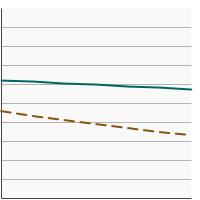
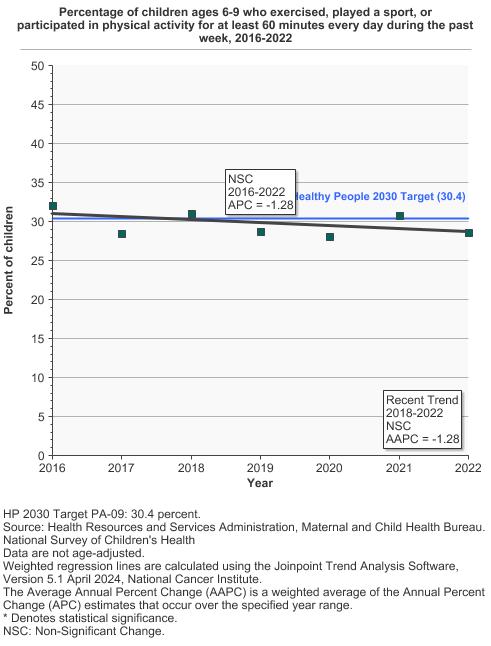
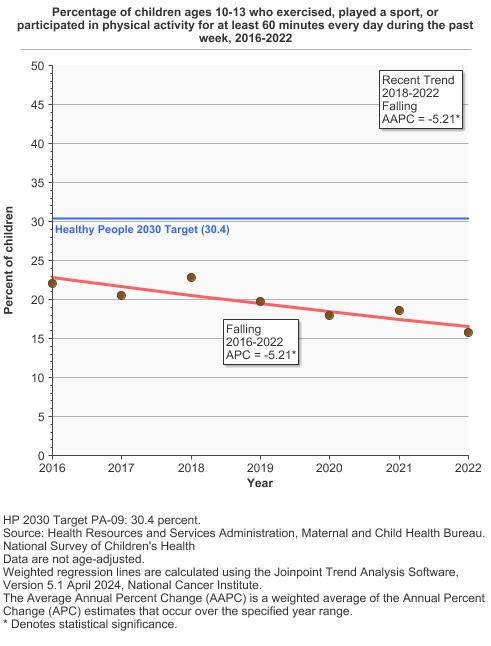
Ages 6-9 28.6 27.0 - 30.3 Ages 10-13 15.7 14.5 - 17.0
- Adolescents (Grades 9 to 12), Aerobic Physical Activity
- By Sex
Percentage of adolescents in high school (grades 9-12) who were physically active at least 60 minutes per day by sex, 2011-2021 Overview Graph Detailed Trend Graphs Most Recent Estimates (2021) Percent of adolescents 95% Confidence Interval 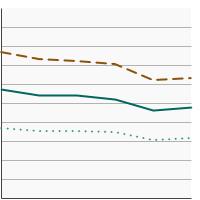
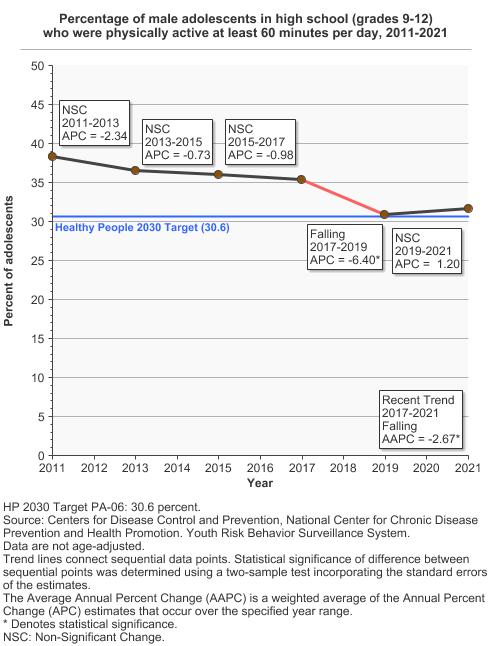
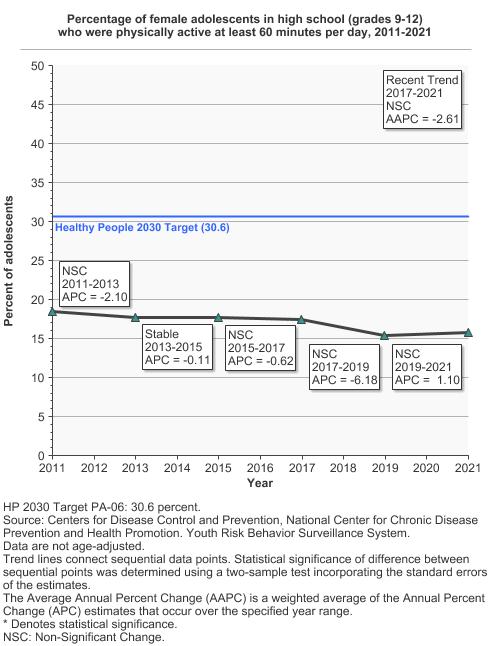
Both Sexes 23.9 22.8 - 25.0 Male 31.7 30.3 - 33.2 Female 15.7 14.1 - 17.4 - By Race/Ethnicity
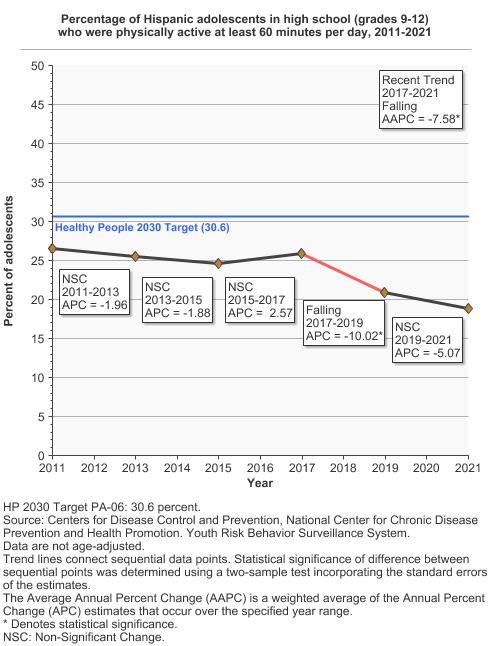
Percentage of adolescents in high school (grades 9-12) who were physically active at least 60 minutes per day by race/ethnicity, 2011-2021 Overview Graph Detailed Trend Graphs Most Recent Estimates (2021) Percent of adolescents 95% Confidence Interval 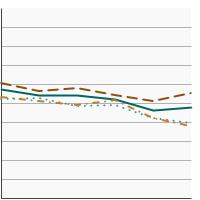
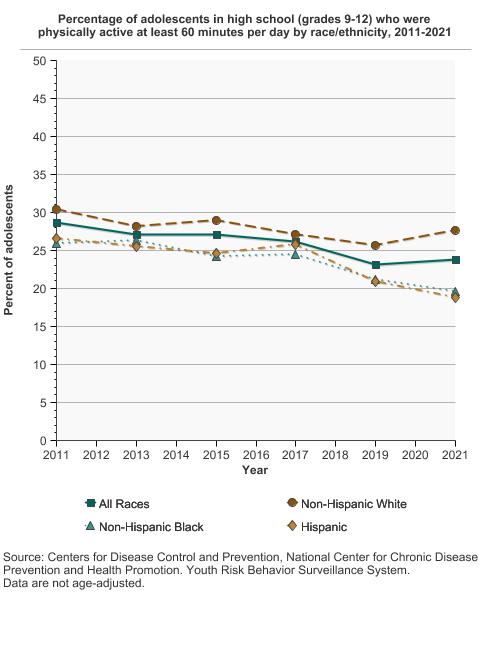
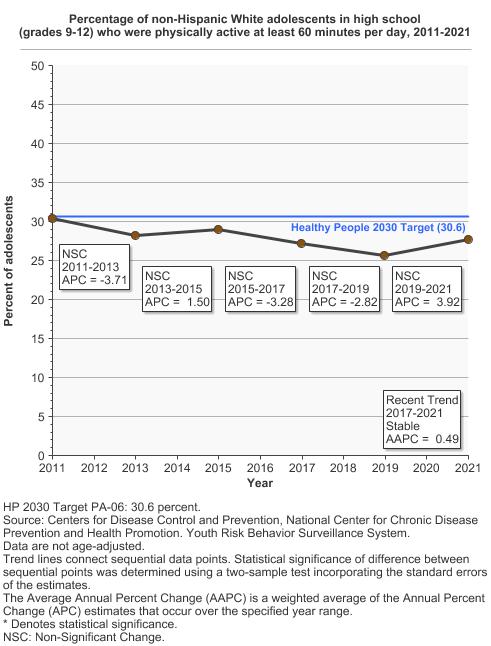
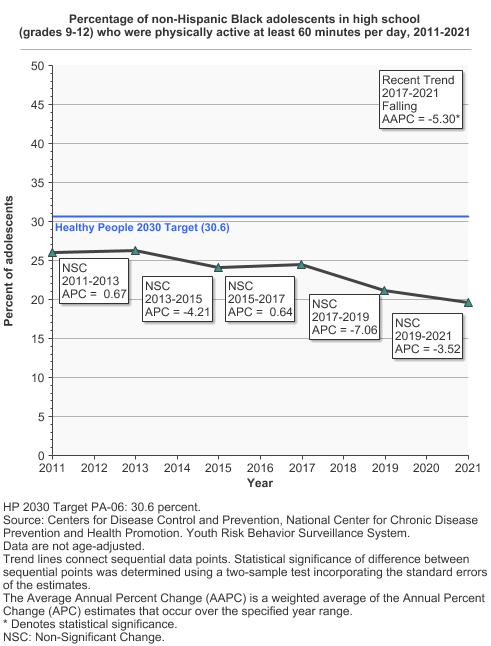
All Races 23.9 22.8 - 25.0 Non-Hispanic White 27.7 25.1 - 30.4 Non-Hispanic Black 19.7 17.5 - 22.0 Hispanic 18.9 17.3 - 20.5 - By High School Grade
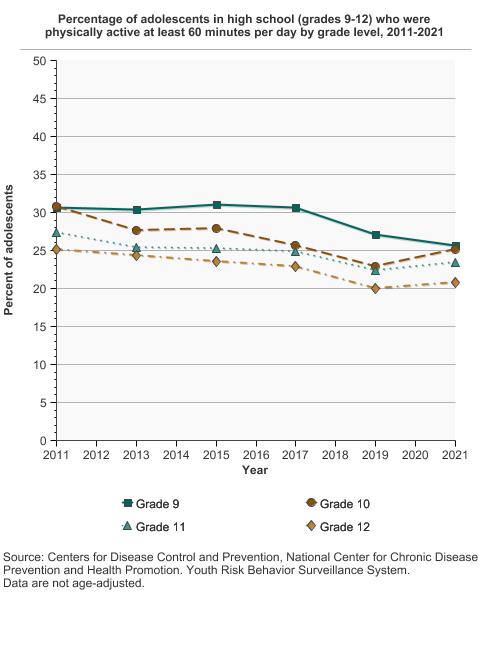
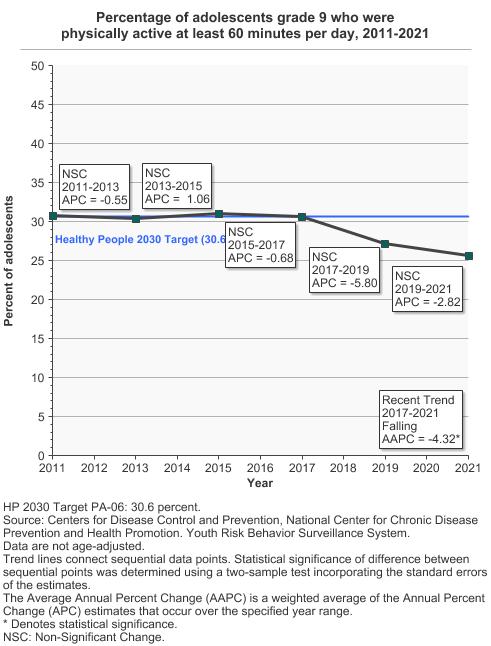
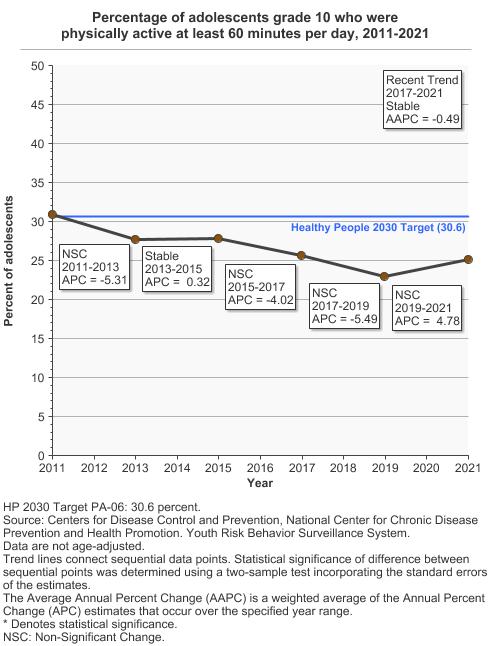
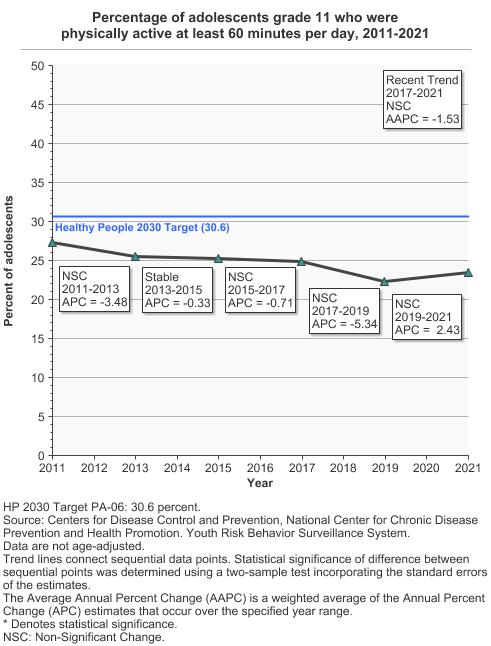
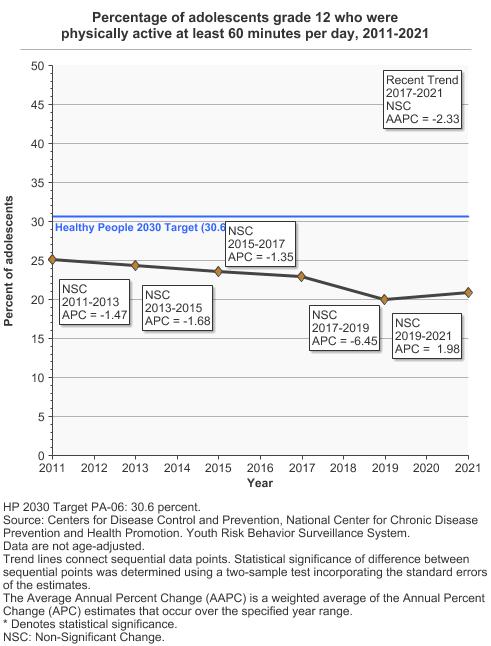
Percentage of adolescents in high school (grades 9-12) who were physically active at least 60 minutes per day by grade level, 2011-2021 Overview Graph Detailed Trend Graphs Most Recent Estimates (2021) Percent of adolescents 95% Confidence Interval 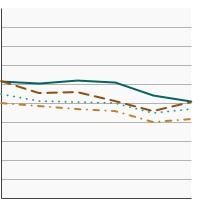
Grade 9 25.7 23.7 - 27.7 Grade 10 25.1 23.1 - 27.3 Grade 11 23.4 21.5 - 25.5 Grade 12 20.8 18.9 - 23.0
- Adolescents (Grades 9 to 12), Muscle Strengthening Activity
- By Sex
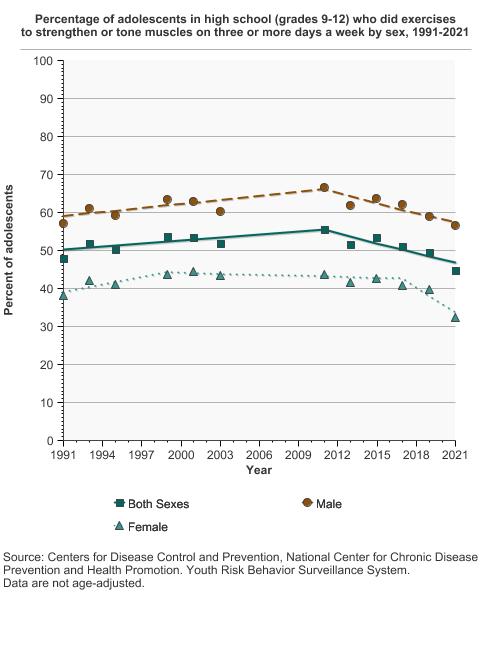
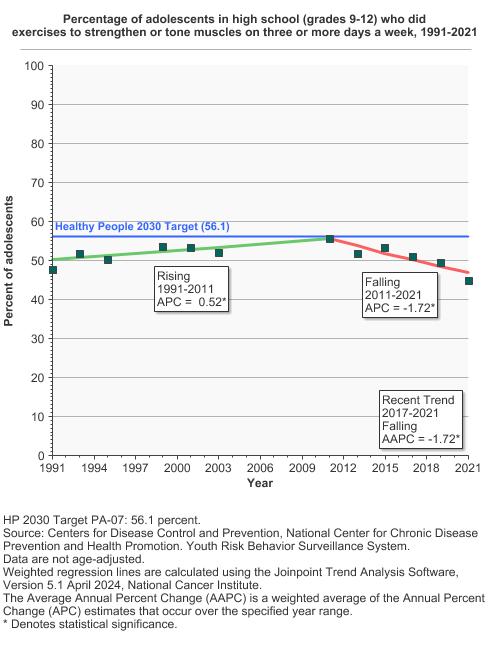
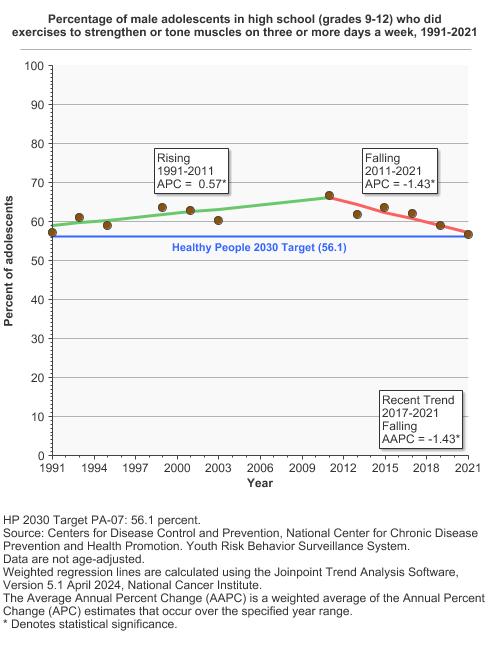
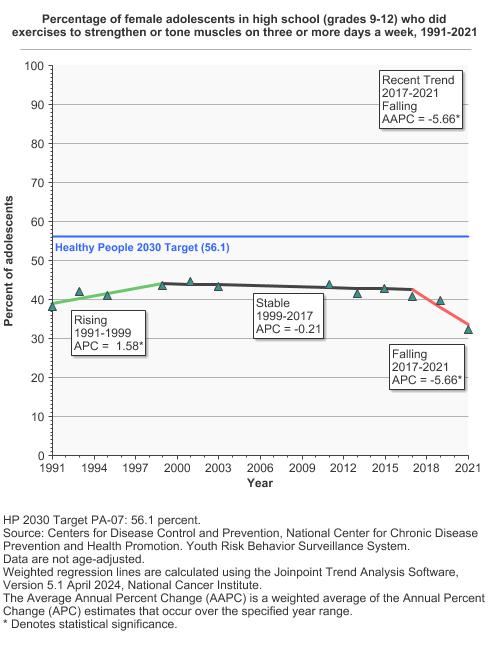
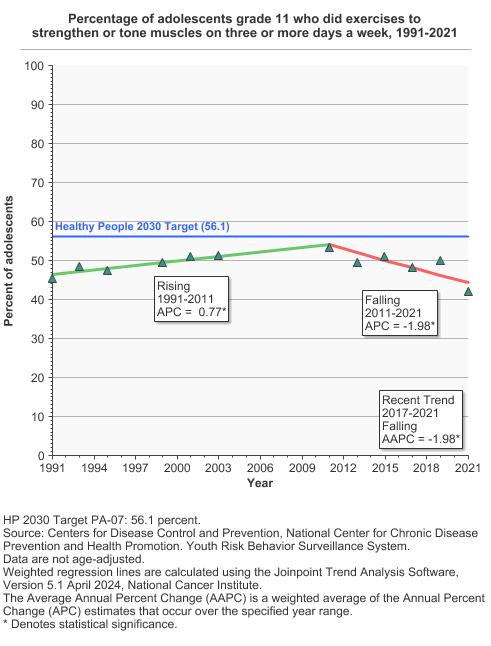
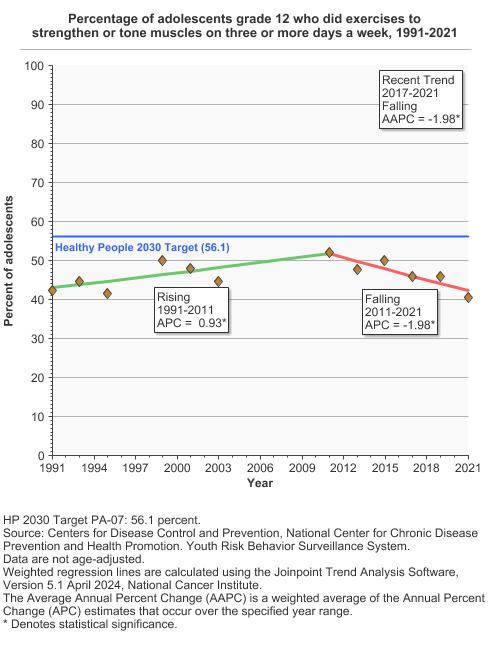
Percentage of adolescents in high school (grades 9-12) who did exercises to strengthen or tone muscles on three or more days a week by sex, 1991-2021 Overview Graph Detailed Trend Graphs Most Recent Estimates (2021) Percent of adolescents 95% Confidence Interval 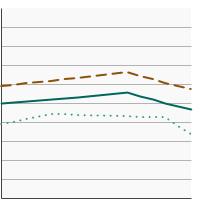
Both Sexes 44.9 42.5 - 47.2 Male 56.6 54.4 - 58.8 Female 32.4 29.7 - 35.1 - By Race/Ethnicity
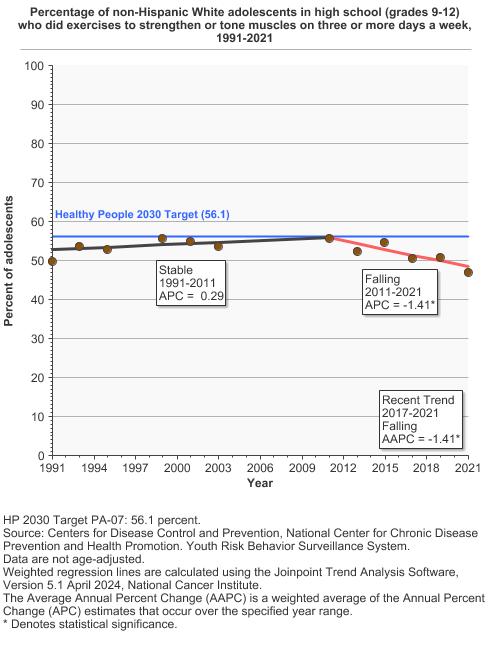
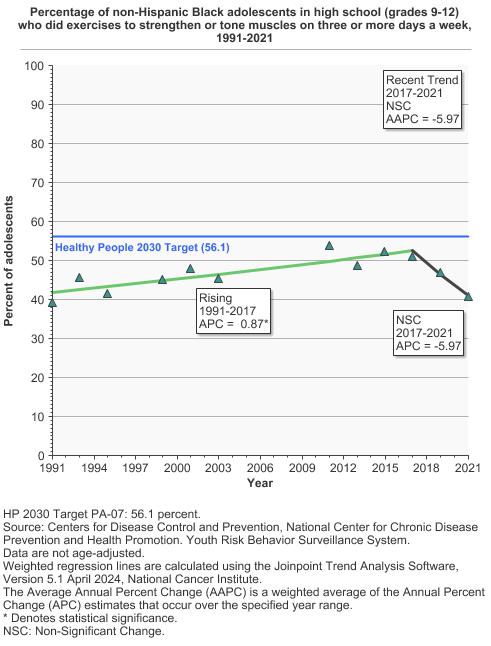
Percentage of adolescents in high school (grades 9-12) who did exercises to strengthen or tone muscles on three or more days a week by race/ethnicity, 1991-2021 Overview Graph Detailed Trend Graphs Most Recent Estimates (2021) Percent of adolescents 95% Confidence Interval 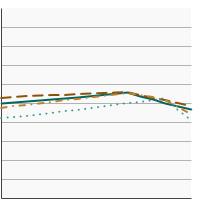
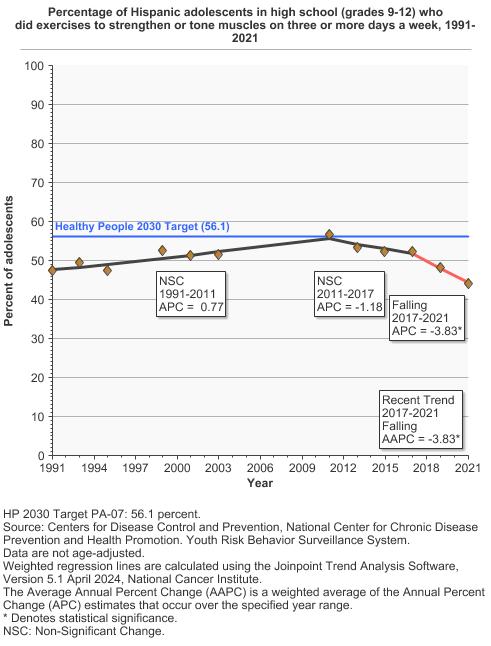
All Races 44.9 42.5 - 47.2 Non-Hispanic White 47.0 43.3 - 50.6 Non-Hispanic Black 40.7 36.1 - 45.4 Hispanic 44.2 41.9 - 46.5 - By High School Grade
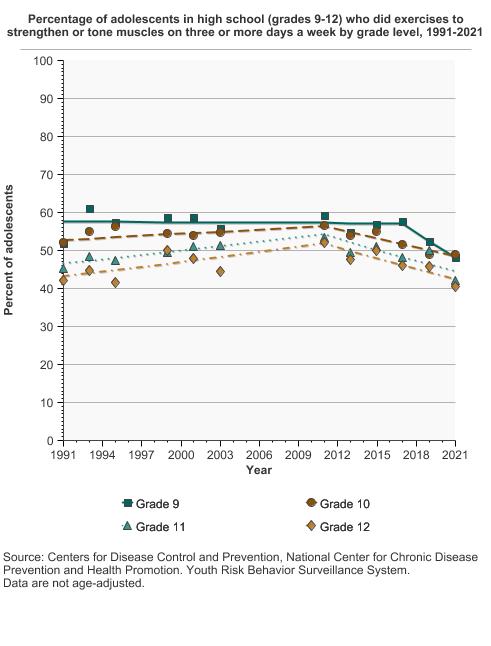
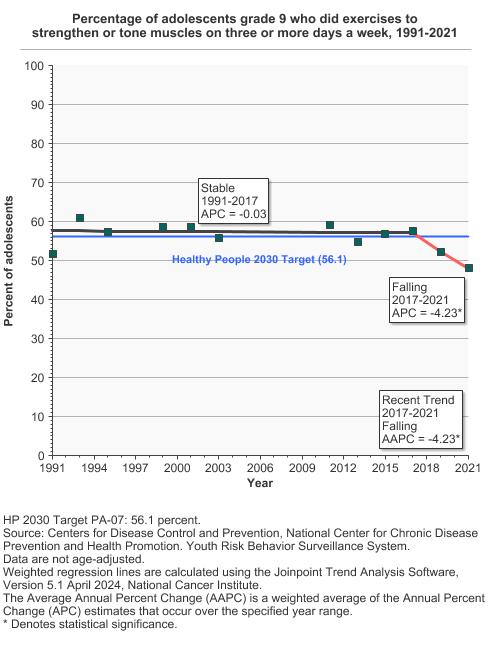
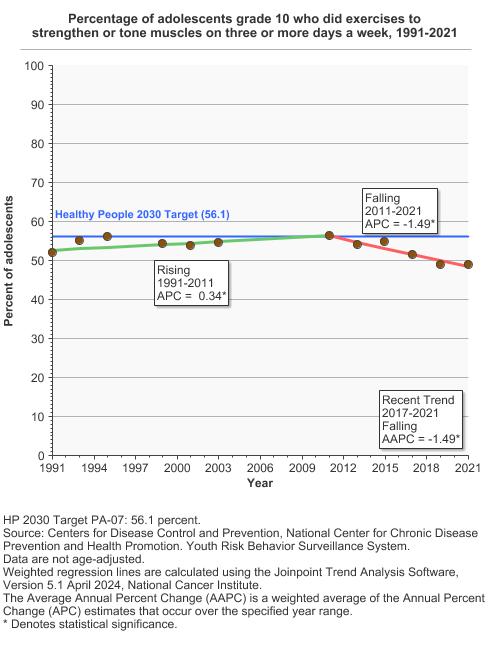
Percentage of adolescents in high school (grades 9-12) who did exercises to strengthen or tone muscles on three or more days a week by grade level, 1991-2021 Overview Graph Detailed Trend Graphs Most Recent Estimates (2021) Percent of adolescents 95% Confidence Interval 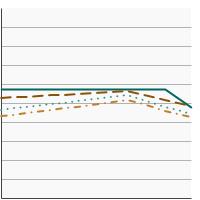
Grade 9 48.1 44.8 - 51.4 Grade 10 48.9 45.2 - 52.6 Grade 11 42.0 39.5 - 44.5 Grade 12 40.4 37.6 - 43.3


Additional Information
- Physical Activity and Cancer. National Cancer Institute.
- Physical Activity. Centers for Disease Control and Prevention.
- Making Physical Activity a Part of a Child’s Life. Centers for Disease Control and Prevention.
- Physical Activity Guidelines for Americans. U.S. Department of Health & Human Services.
- PAG Midcourse Report: Strategies to Increase Physical Activity Among Youth. U.S. Department of Health & Human Services.
- Summary: 2022 US Report Card on Physical Activity for Children and Youth. Physical Activity Alliance.
- Physical Activity Evidence-Based Programs Listing. National Cancer Institute.
- Community Preventive Services Task Force Findings: Physical Activity. The Community Guide.
- Move Your Way® Community Resources. U.S. Department of Health and Human Services.
- ACS Guideline on Nutrition and Physical Activity for Cancer Prevention. American Cancer Society.
- 2018 Physical Activity Guidelines Advisory Committee Scientific Report. Part F. Chapter 7. Youth. U.S. Department of Health and Human Services. 2018; F7-1 — F7-26.
- Influence of Physical Activity at a Young Age and Lifetime Physical Activity on the Risks of 3 Obesity-Related Cancers: Systematic Review and Meta-Analysis of Observational Studies. Hidayat K, Du X, Zou S-Y, et al. Nutr Rev. 2020;78(1):1-18.
- Physical Activity from Menarche-to-First Pregnancy and Risk of Breast Cancer: The California Teachers Study. Lin D, Liu Y, Tobias DK, et al. Cancer Causes Control. 2022;33(11):1343-1353.
- Childhood and Teenage Physical Activity and Breast Cancer Risk. Niehoff NM, White AJ, Sandler DP. Breast Cancer Res Treat. 2017;164(3):697-705.
- American College of Sports Medicine Roundtable Report on Physical Activity, Sedentary Behavior, and Cancer Prevention and Control. Patel AV, Friedenreich CM, Moore SC, et al. Med Sci Sports Exerc. 2019;51(11):2391-2402.
- Physical Activity During Adolescence and Risk of Colorectal Adenoma Later in Life: Results from the Nurses’ Health Study II. Rezende LFM de, Lee DH, Keum N, et al. Br J Cancer. 2019;121(1):86-94.
- FastStats – Exercise or Physical Activity. Centers for Disease Control and Prevention.