On This Page:
- Background
- Measure
- Healthy People 2030 Target
- Data Source
- Trends and Most Recent Estimates
- Related Cancers
- Additional Information
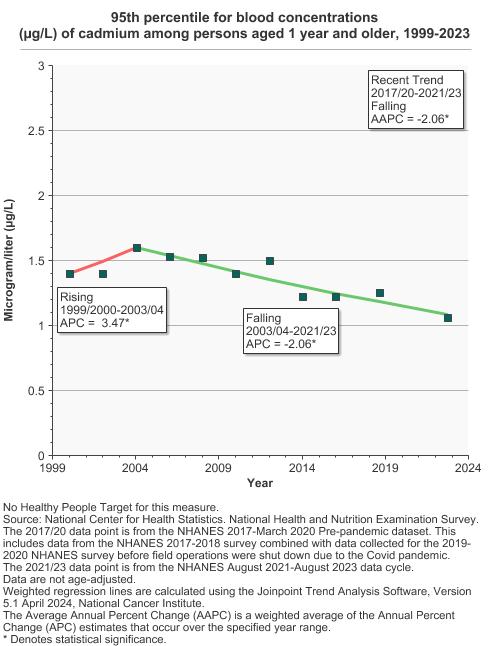
From 2021 to 2023, 95th percentile for the blood concentration of cadmium among persons aged 1 year and older was 1.1 µg/L.

Background
Cadmium is an element found in low concentrations in the earth’s crust. It is usually found as a mineral combined with other elements such as oxygen (cadmium oxide), chlorine (cadmium chloride), or sulfur (cadmium sulfate, cadmium sulfide).
All soils and rocks, including coal and mineral fertilizers, contain some cadmium. Most cadmium used in the United States is extracted during the production of other metals like zinc, lead, and copper. Cadmium has many uses, including in the production of batteries, pigments, metal coatings, and plastics.
Cadmium and its compounds are highly toxic and exposure is known to cause cancer. It is primarily associated with human lung, prostate, and kidney cancers, and recently pancreatic cancer. It has also been associated with cancers of the breast and urinary bladder.
The general population may be exposed to small amounts of cadmium daily through food, tobacco smoke (as active or secondhand smoke), drinking water, and air. Cadmium is introduced to the food chain through agricultural soils, which may naturally contain cadmium; anthropogenic (human) sources; cadmium-based pigments; and stabilizers used in certain plastics. While dietary sources can be sporadic, intake from tobacco occurs with each cigarette smoked and can proceed for decades, resulting in accumulation of metals like cadmium in the body. Cadmium levels are expected to be low in drinking water and ambient air, except in the vicinity of cadmium-emitting industries or incinerators.
Occupational exposure to cadmium primarily occurs in operations involving heating cadmium-containing products. Occupations with the highest potential for exposure include alloy production, battery production, pigment production and use, plastics production, and smelting and refining. Although levels vary widely among the different industries, occupational exposures generally have decreased since the 1970s.
Measure
We present exposure data on the 95th percentile of the population, representing people with the greatest exposure. The 95th percentile level means that 95% of the population has concentrations below that level. Public health officials use such reference values to determine whether groups of people are experiencing an exposure that is unusual compared with an exposure experienced by the rest of the population. For more information, see the National Report on Human Exposure to Environmental Chemicals, published by the Centers for Disease Control and Prevention.
To calculate whether the differences between 95th percentiles for two different time points is statistically significant, we used a different statistical methodology than that used by the National Center for Environmental Health, which publishes the National Report on Human Exposure to Environmental Chemicals from where our data are derived. Our estimates may differ slightly from those in the original report due to differences in statistical procedures used. [Methodology]
Data Source
Centers for Disease Control and Prevention, National Center for Health Statistics, National Health and Nutrition Examination Survey (NHANES).
The NHANES 2017-2018 data point was replaced with the NHANES 2017-March 2020 Pre-pandemic data point. More information is available at NHANES Questionnaires, Datasets, and Related Documentation.
Healthy People 2030 Target
There are no Healthy People 2030 targets regarding blood levels of cadmium.
Healthy People 2030 is a set of goals set forth by the Department of Health and Human Services.
Trends and Most Recent Estimates
- By Sex
-
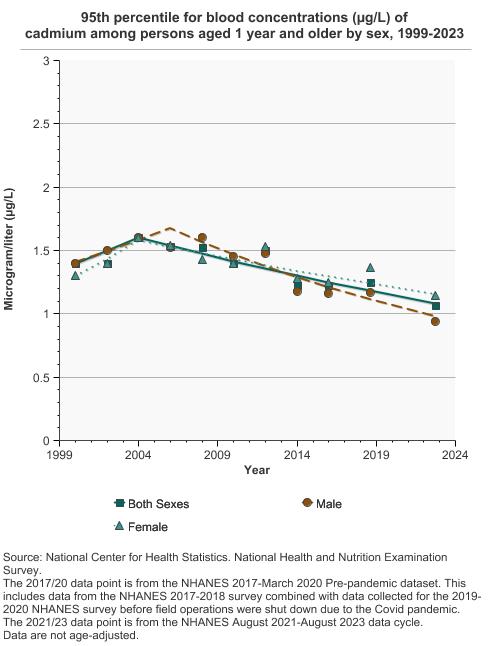
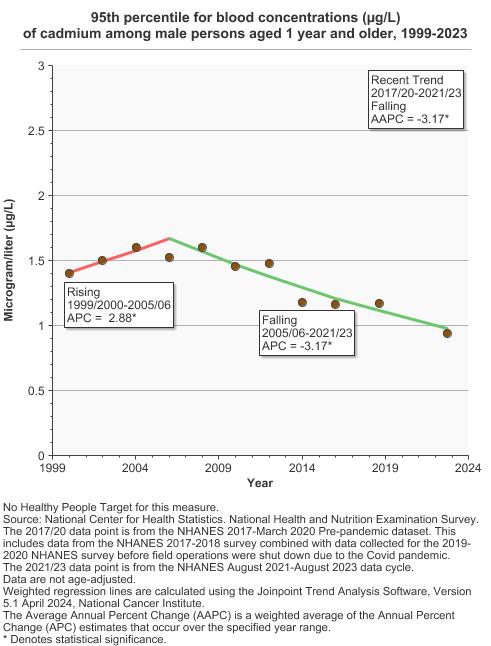
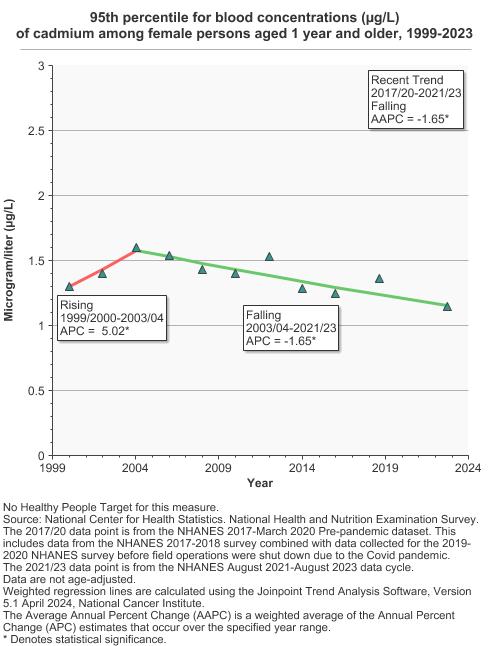
95th percentile for blood concentrations (µg/L) of cadmium among persons aged 1 year and older by sex, 1999-2023 Overview Graph Detailed Trend Graphs Most Recent Estimates (2021 to 2023) Dependent Variable 95% Confidence Interval 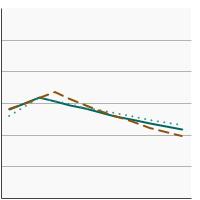

Both Sexes 
1.1 0.9 - 1.2 Male
0.9 0.8 - 1.2 Female
1.1 1.0 - 1.3 The 2021 to 2023 data point is from the NHANES August 2021-August 2023 data cycle. - By Race/Ethnicity
-
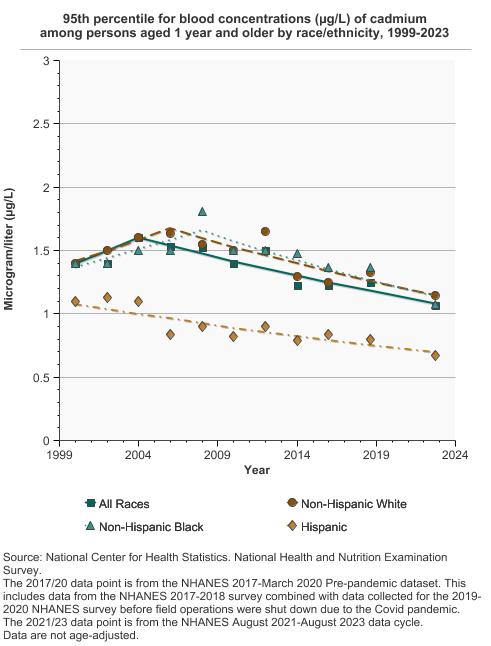
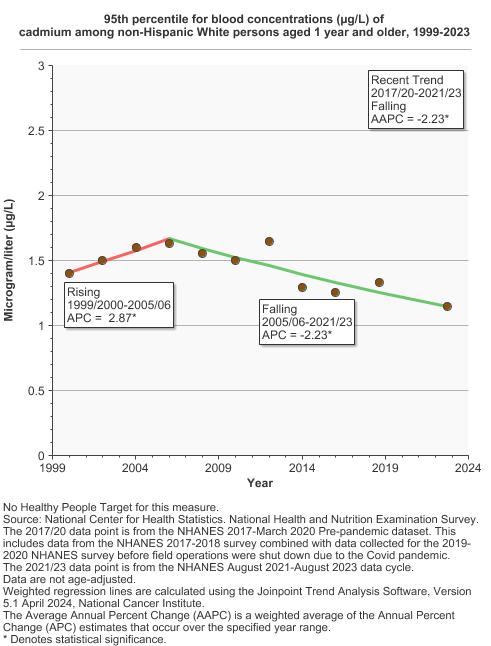
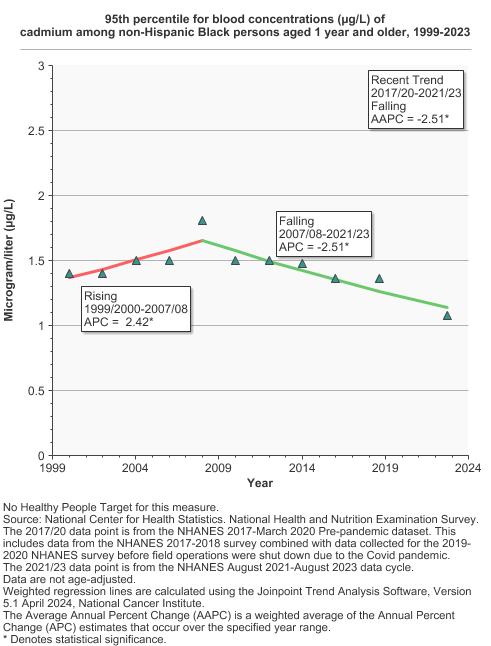
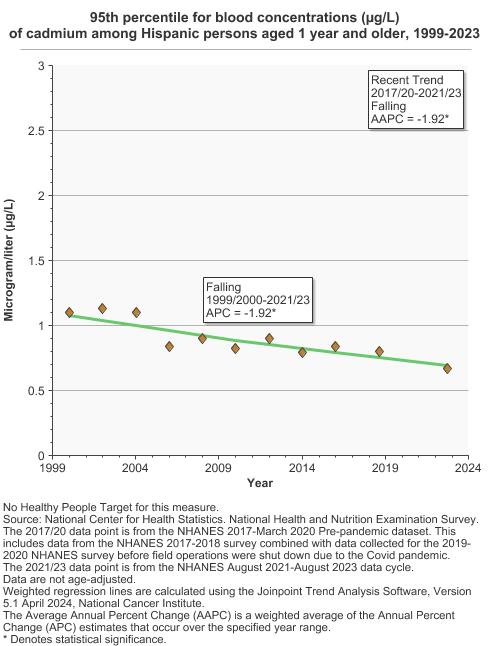
95th percentile for blood concentrations (µg/L) of cadmium among persons aged 1 year and older by race/ethnicity, 1999-2023 Overview Graph Detailed Trend Graphs Most Recent Estimates (2021 to 2023) Dependent Variable 95% Confidence Interval 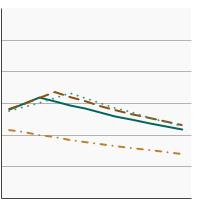
All Races
1.1 0.9 - 1.2 Non-Hispanic White
1.1 1.0 - 1.3 Non-Hispanic Black
1.1 0.9 - 1.2 Hispanic
0.7 0.6 - 0.9 The 2021 to 2023 data point is from the NHANES August 2021-August 2023 data cycle. - By Age
-
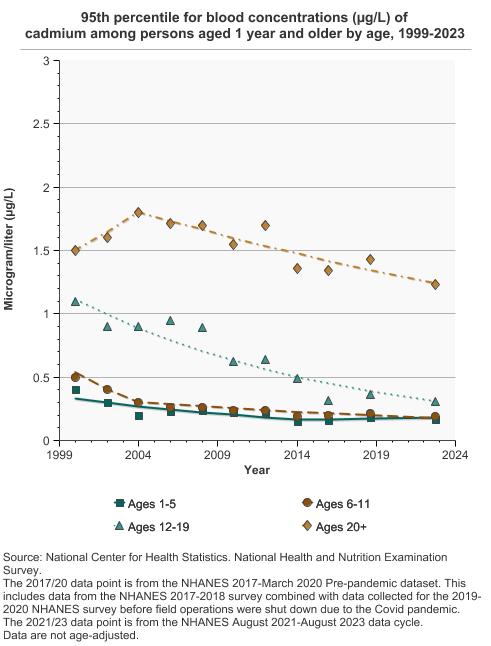
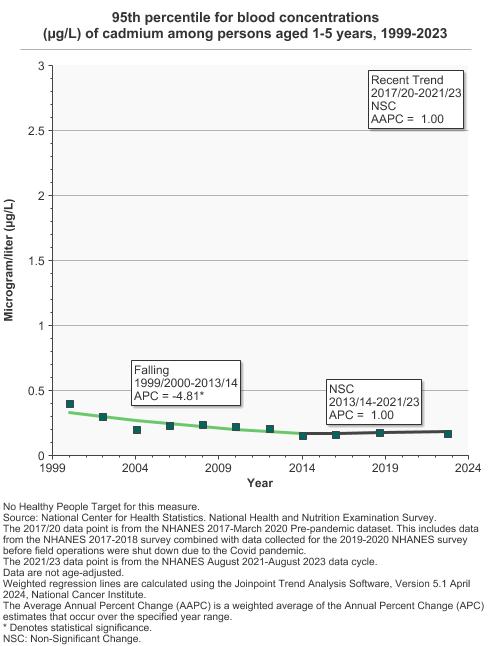
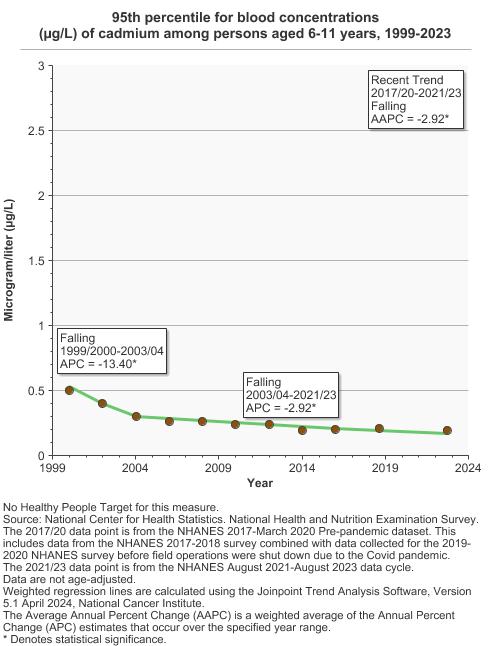
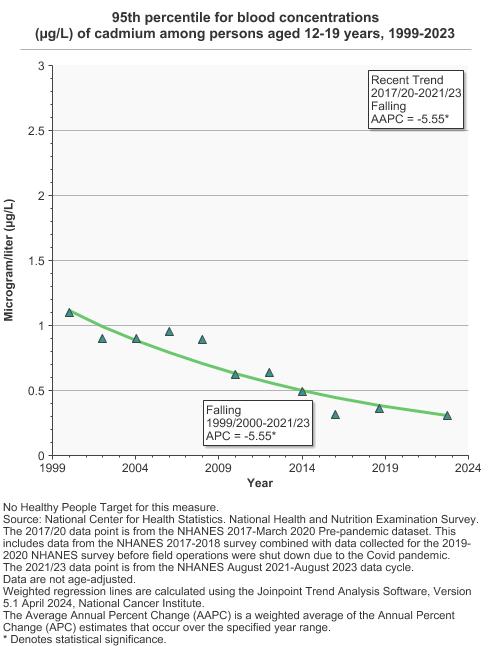
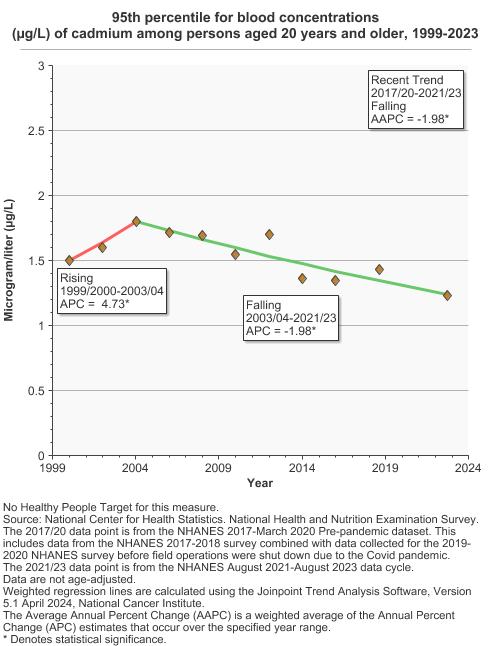
95th percentile for blood concentrations (µg/L) of cadmium among persons aged 1 year and older by age, 1999-2023 Overview Graph Detailed Trend Graphs Most Recent Estimates (2021 to 2023) Dependent Variable 95% Confidence Interval 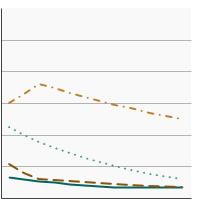
Ages 1-5
0.2 0.1 - 0.2 Ages 6-11
0.2 0.2 - 0.2 Ages 12-19
0.3 0.3 - 0.4 Ages 20+
1.2 1.1 - 1.4 The 2021 to 2023 data point is from the NHANES August 2021-August 2023 data cycle. - By Poverty Income Level
-
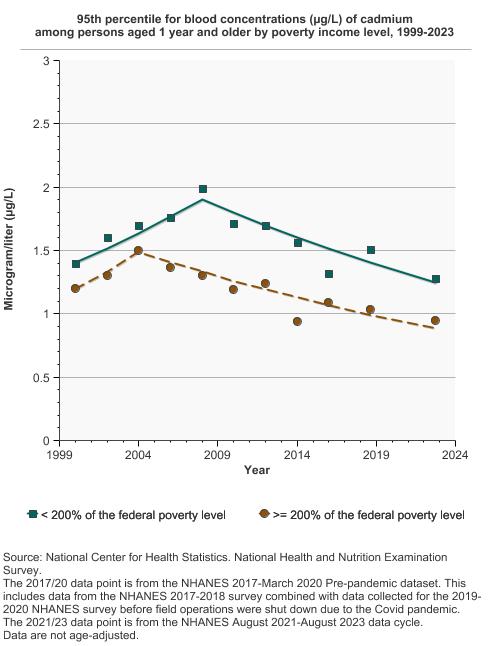
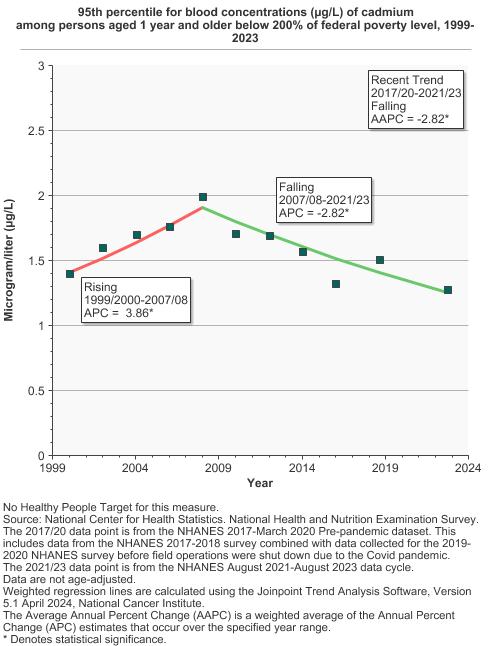
95th percentile for blood concentrations (µg/L) of cadmium among persons aged 1 year and older by poverty income level, 1999-2023 Overview Graph Detailed Trend Graphs Most Recent Estimates (2021 to 2023) Dependent Variable 95% Confidence Interval 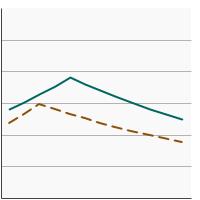
< 200% of the federal poverty level
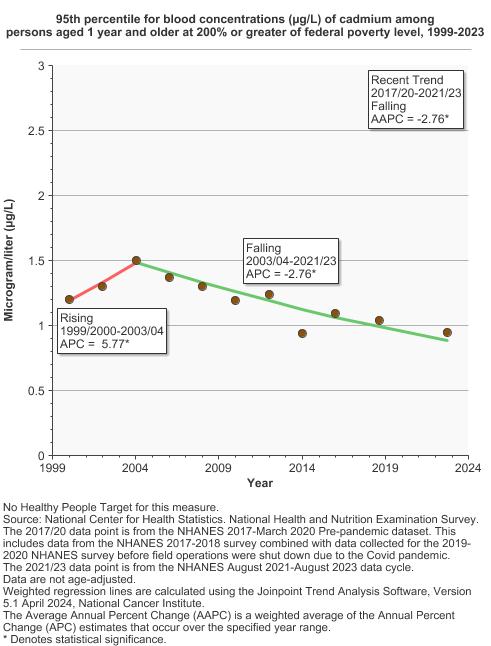
1.3 1.1 - 1.5 >= 200% of the federal poverty level
0.9 0.8 - 1.1 The 2021 to 2023 data point is from the NHANES August 2021-August 2023 data cycle. - By Education Level
-
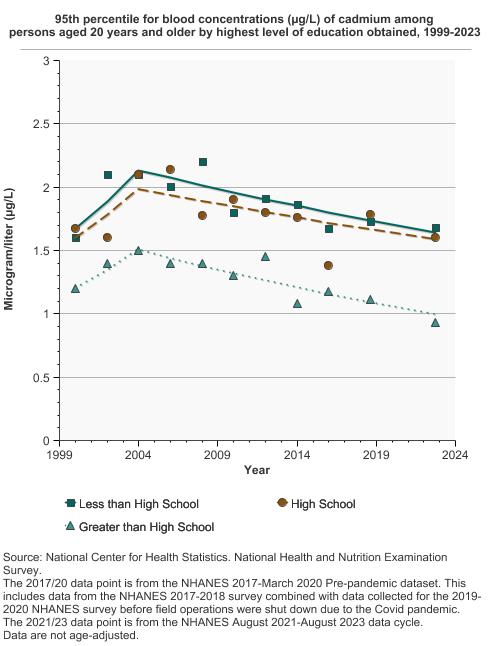
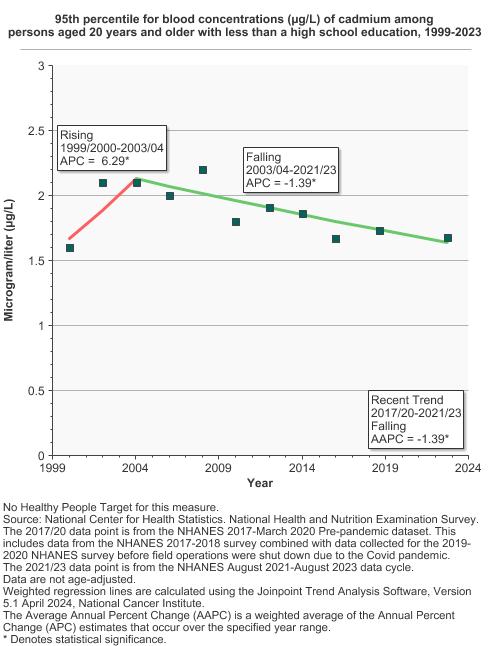
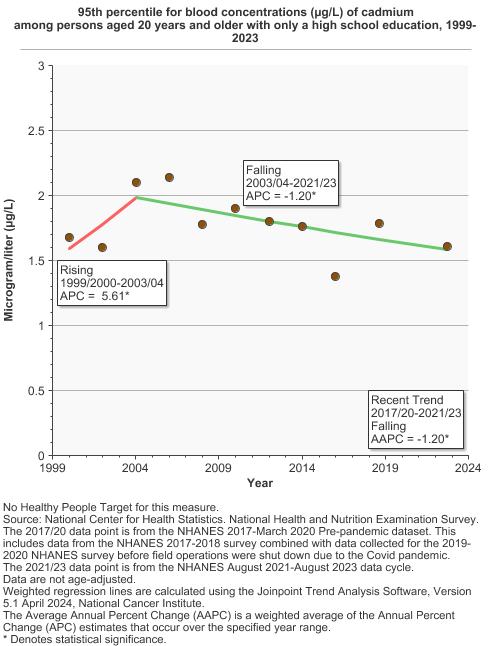
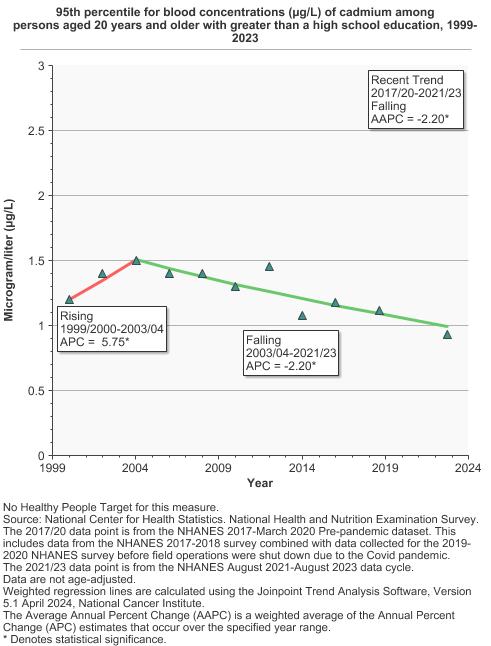
95th percentile for blood concentrations (µg/L) of cadmium among persons aged 20 years and older by highest level of education obtained, 1999-2023 Overview Graph Detailed Trend Graphs Most Recent Estimates (2021 to 2023) Dependent Variable 95% Confidence Interval 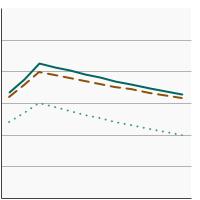
Less than High School
1.7 1.5 - 1.8 High School
1.6 1.4 - 1.8 Greater than High School
0.9 0.8 - 1.1 The 2021 to 2023 data point is from the NHANES August 2021-August 2023 data cycle. - By Smoking Status
-
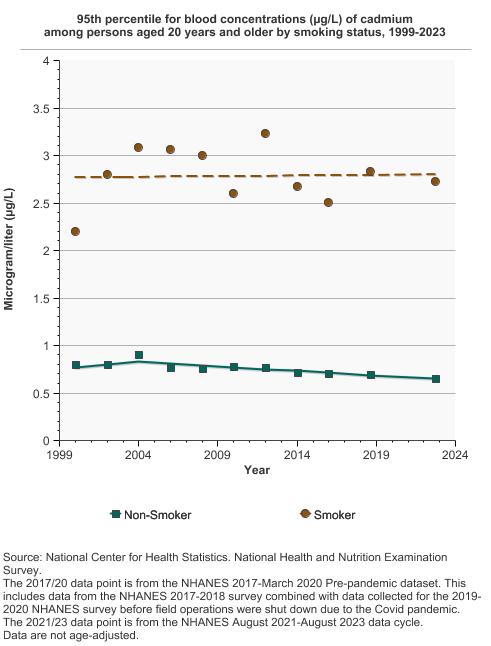
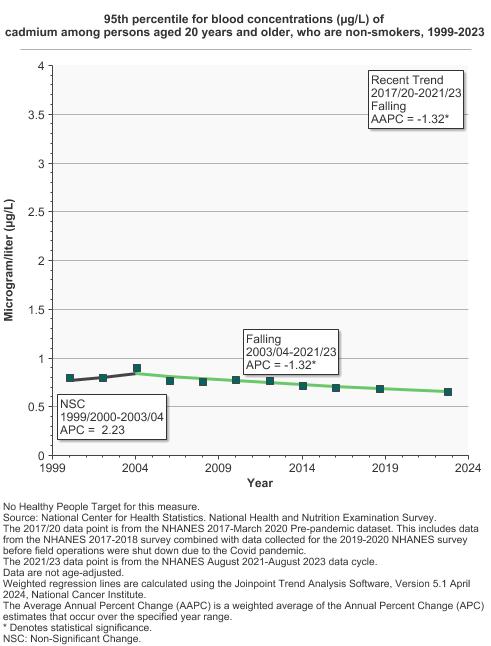
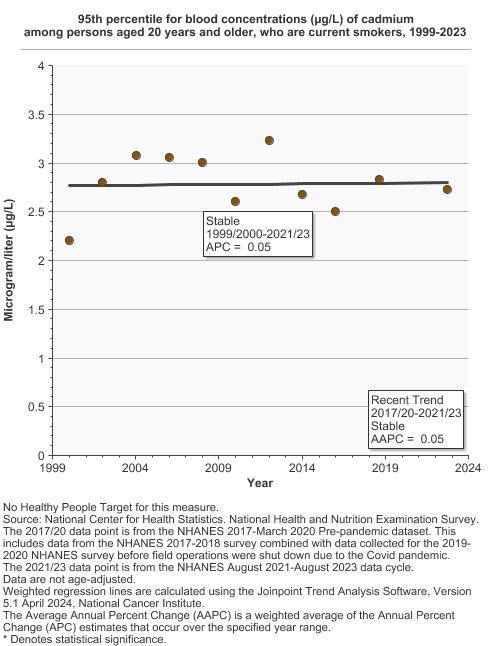
95th percentile for blood concentrations (µg/L) of cadmium among persons aged 20 years and older by smoking status, 1999-2023 Overview Graph Detailed Trend Graphs Most Recent Estimates (2021 to 2023) Dependent Variable 95% Confidence Interval 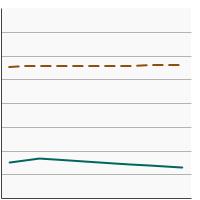
Non-Smoker
0.7 0.6 - 0.7 Smoker
2.7 2.4 - 3.1 The 2021 to 2023 data point is from the NHANES August 2021-August 2023 data cycle.
Additional Information
- Cadmium. National Cancer Institute.
- Toxic Substances Portal – Cadmium. Agency for Toxic Substances & Disease Registry.
- Fourth National Report on Human Exposure to Environmental Chemicals: Updated Tables, March 2018, Volume One. Centers for Disease Control and Prevention.
- Fourth National Report on Human Exposure to Environmental Chemicals: Updated Tables, March 2018, Volume Two. Centers for Disease Control and Prevention.
- Workplace Safety & Health Topics – Cadmium. Centers for Disease Control and Prevention, National Institute for Occupational Safety and Health.
- Drinking Water Requirements for States and Public Water Systems: Chemical Contaminant Rules. Environmental Protection Agency.
- Cadmium Compounds. Environmental Protection Agency.
- Cadmium. U.S. Department of Labor, Occupational Safety & Health Administration.
- Arsenic, Cadmium, Chromium, Lead. Agency for Toxic Substances & Disease Registry.
- Minimal Risk Levels (MRLs) for Hazardous Substances. Agency for Toxic Substances & Disease Registry.
- ToxGuide™ for Cadmium. Agency for Toxic Substances & Disease Registry.
- Cadmium. Environmental Protection Agency, Integrated Risk Information System.
- Cadmium exposure and cancer mortality in a prospective cohort: the strong heart study. Garcia-Esquinas E, Pollan M, Tellez-Plaza M, et al. Environ Health Perspect 2014;122(4):363–370.
- Cadmium-induced cancers in animals and in humans. Huff J, Lunn RM, Waalkes MP, et al. Int J Occup Environ Health 2007;13(2):202–12.
- Arsenic, Metals, Fibres, and Dusts. International Agency for Research on Cancer. IARC Monographs on the Evaluation of Carcinogenic Risks to Humans 2012;100c:121–145.
- Cadmium-induced pathologies: where is the oxidative balance lost (or not)? Nair AR, DeGheselle O, Smeets K, et al. Int J Mol Sci 2013;14(3):6116–6143.
- Cadmium exposure in the population: from health risks to strategies of prevention. Nawrot TS, Staessen JA, Roels HA, et al. Biometals 2010;23(5):769–82.
- Tobacco smoke exposure and levels of urinary metals in the U.S. youth and adult population: The National Health and Nutrition Examination Survey (NHANES) 1999–2004. Richter PA, Bishop EE, Wang J, et al. Int J Environ Res Public Health 2009;6(7):1930-1946.
- Cadmium exposure and incident peripheral arterial disease. Tellez-Plaza M, Guallar E, Fabsitz RR, et al. Circ Cardiovasc Qual Outcomes 2013;6(6):626–33.
- Cadmium exposure and incident cardiovascular disease. Tellez-Plaza M, Guallar E, Howard BV, et al. Epidemiology 2013;24(3):421–9.
- Cadmium and Cadmium Compounds. U.S. Department of Health and Human Services, National Toxicology Program. Report on Carcinogens, Fourteenth Edition 2016.