
Chemical Exposures - Prevention Summary Table
Only one measure per topic is displayed in the summary table. A complete set of measures, where they exist, can be found by following the More Information link in the table below.
 |
green - headed in the right direction |
 |
red - headed in the wrong direction |
 |
black - stable or non-significant change (NSC) |
 |
purple - indeterminate |
 |
blue - Healthy People 2030 target |
| Measure Name | Perfluoroalkyl and Polyfluoroalkyl Substances (PFAS) |
|---|---|
| Year Range | 1999-2018 |
| Measure |
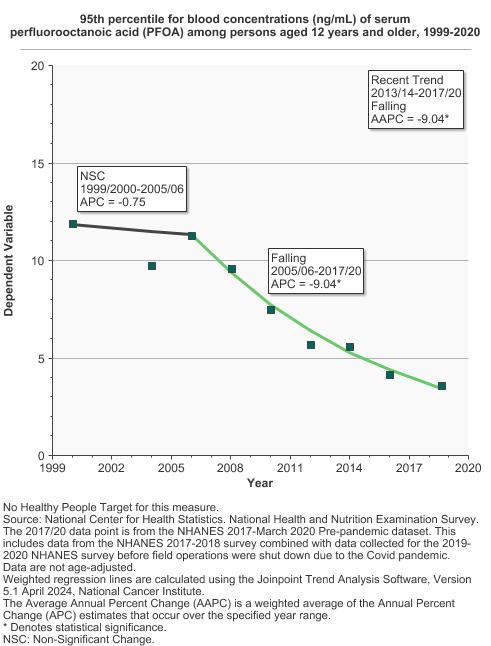
Over the years, many epidemiologic studies have primarily examined specific PFAS compounds such as PFOA and perfluorooctane sulfonate (PFOS) due to their early discovery and past industrial usage. While other PFAS compounds exist, we focus on PFOA and PFOS due to the existing assessment within the National Health and Nutritional Examination Survey. |
| Recent Summary Trend | Falling |
| Recent Summary Trend Year Range | 2013-2018 |
| Desired Direction | Falling |
| Summary Graph |
|
| Trends and Most Recent Estimates | In 2017 to 2018, the 95th percentile for blood concentration of serum perfluorooctanoic acid (PFOA) among persons aged 12 years and older was 3.8 ng/mL. |
| Healthy People 2020 Target | No Healthy People Target for this measure. |
| More Information | Perfluoroalkyl and Polyfluoroalkyl Substances (PFAS) |
| Measure Name | Arsenic |
|---|---|
| Year Range | 2003-2018 |
| Measure |
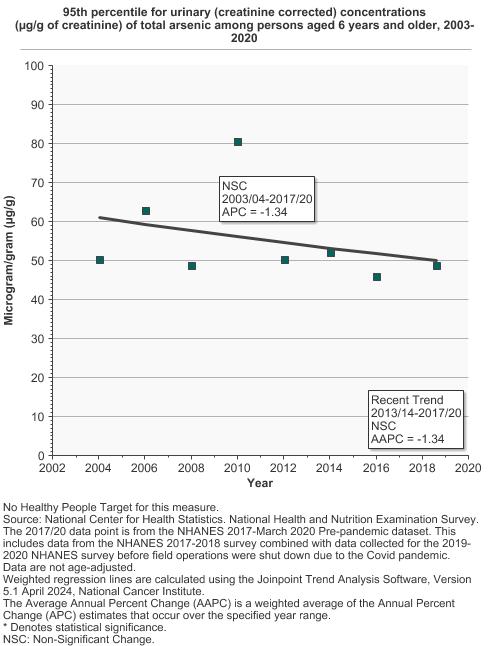
We present exposure data on the 95th percentile of the population, representing people with the greatest exposure. The 95th percentile level means that 95% of the population has concentrations below that level. Public health officials use such reference values to determine whether groups of people are experiencing an exposure that is unusual compared with an exposure experienced by the rest of the population. |
| Recent Summary Trend | Non-Significant Change |
| Recent Summary Trend Year Range | 2013-2018 |
| Desired Direction | Falling |
| Summary Graph |
|
| Trends and Most Recent Estimates | In 2017 to 2018, the 95th percentile for urinary (creatinine corrected) concentration of arsenic among persons aged 6 years and older was 52.2 µg/g of creatinine. |
| Healthy People 2020 Target | No Healthy People Target for this measure. |
| More Information | Arsenic |
| Measure Name | Cadmium |
|---|---|
| Year Range | 1999-2018 |
| Measure |
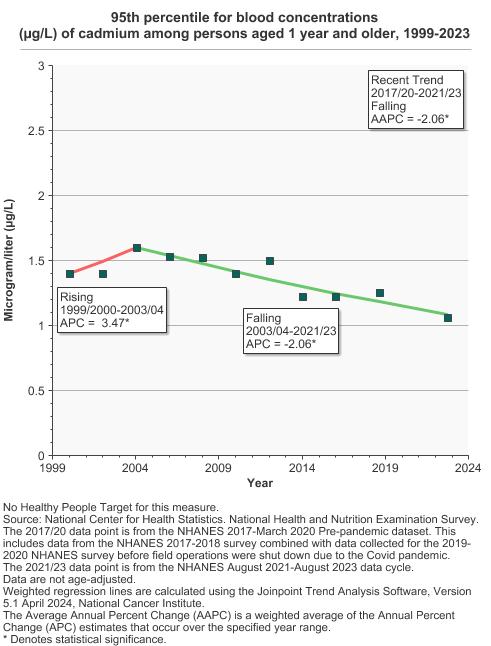
We present exposure data on the 95th percentile of the population, representing people with the greatest exposure. The 95th percentile level means that 95% of the population has concentrations below that level. |
| Recent Summary Trend | Falling |
| Recent Summary Trend Year Range | 2013-2018 |
| Desired Direction | Falling |
| Summary Graph |
|
| Trends and Most Recent Estimates | In 2017 to 2018, the 95th percentile for blood concentration of cadmium among persons aged 1 year and older was 1.3 µg/L. |
| Healthy People 2020 Target | No Healthy People Target for this measure. |
| More Information | Cadmium |
| Measure Name | Nitrate |
|---|---|
| Year Range | 2001-2018 |
| Measure |
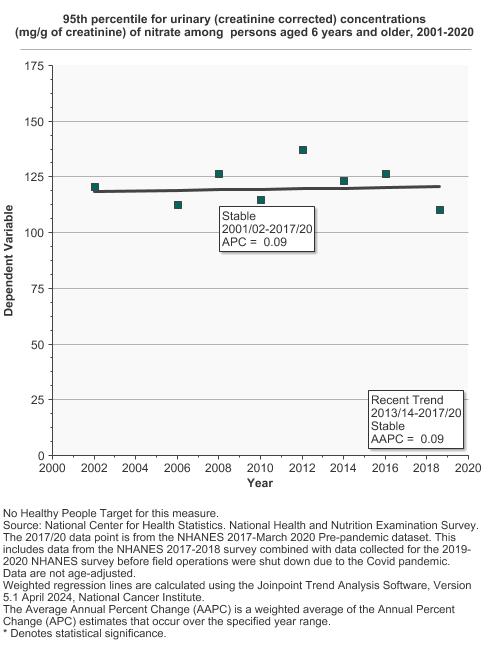
We present exposure data on the 95th percentile of the population, representing people with the greatest exposure. The 95th percentile level means that 95% of the population has concentrations below that level. |
| Recent Summary Trend | Stable |
| Recent Summary Trend Year Range | 2013-2018 |
| Desired Direction | Falling |
| Summary Graph |
|
| Trends and Most Recent Estimates | In 2017 to 2018, the 95th percentile for urinary (creatinine corrected) concentration of nitrate among persons aged 6 years and older was 113.0 mg/g of creatinine. |
| Healthy People 2020 Target | No Healthy People Target for this measure. |
| More Information | Nitrate |
| Measure Name | Benzene |
|---|---|
| Year Range | 2001-2018 |
| Measure |
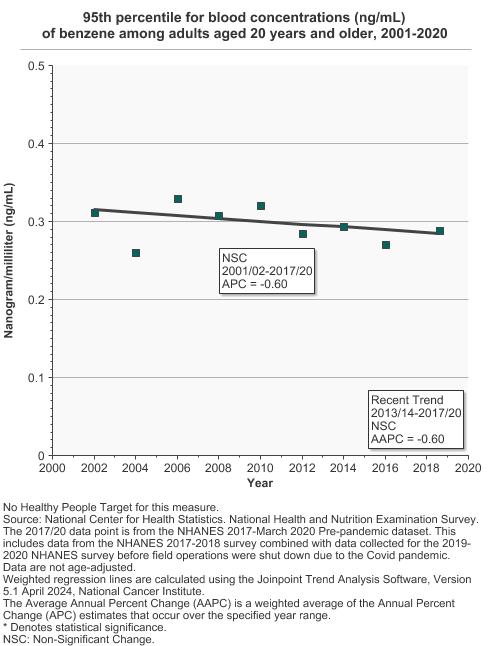
We present exposure data on the 95th percentile of the population, representing people with the greatest exposure. The 95th percentile level means that 95% of the population has concentrations below that level. Public health officials use such reference values to determine whether groups of people are experiencing an exposure that is unusual compared with an exposure experienced by the rest of the population. |
| Recent Summary Trend | Non-Significant Change |
| Recent Summary Trend Year Range | 2013-2018 |
| Desired Direction | Falling |
| Summary Graph |
|
| Trends and Most Recent Estimates | In 2017 to 2018, the 95th percentile for blood concentration of benzene among persons aged 20 years and older was 0.3 ng/mL. |
| Healthy People 2020 Target | No Healthy People Target for this measure. |
| More Information | Benzene |
| Measure Name | Arsenic | Benzene | Cadmium | Nitrate | Perfluoroalkyl and Polyfluoroalkyl Substances (PFAS) |
|---|---|---|---|---|---|
| Year Range | 2003-2018 | 2001-2018 | 1999-2018 | 2001-2018 | 1999-2018 |
| Measure |
We present exposure data on the 95th percentile of the population, representing people with the greatest exposure. The 95th percentile level means that 95% of the population has concentrations below that level. Public health officials use such reference values to determine whether groups of people are experiencing an exposure that is unusual compared with an exposure experienced by the rest of the population. |
We present exposure data on the 95th percentile of the population, representing people with the greatest exposure. The 95th percentile level means that 95% of the population has concentrations below that level. Public health officials use such reference values to determine whether groups of people are experiencing an exposure that is unusual compared with an exposure experienced by the rest of the population. |
We present exposure data on the 95th percentile of the population, representing people with the greatest exposure. The 95th percentile level means that 95% of the population has concentrations below that level. |
We present exposure data on the 95th percentile of the population, representing people with the greatest exposure. The 95th percentile level means that 95% of the population has concentrations below that level. |
Over the years, many epidemiologic studies have primarily examined specific PFAS compounds such as PFOA and perfluorooctane sulfonate (PFOS) due to their early discovery and past industrial usage. While other PFAS compounds exist, we focus on PFOA and PFOS due to the existing assessment within the National Health and Nutritional Examination Survey. |
| Recent Summary Trend | Non-Significant Change | Non-Significant Change | Falling | Stable | Falling |
| Recent Summary Trend Year Range | 2013-2018 | 2013-2018 | 2013-2018 | 2013-2018 | 2013-2018 |
| Desired Direction | Falling | Falling | Falling | Falling | Falling |
| Summary Graph |
|
|
|
|
|
| Trends and Most Recent Estimates | In 2017 to 2018, the 95th percentile for urinary (creatinine corrected) concentration of arsenic among persons aged 6 years and older was 52.2 µg/g of creatinine. | In 2017 to 2018, the 95th percentile for blood concentration of benzene among persons aged 20 years and older was 0.3 ng/mL. | In 2017 to 2018, the 95th percentile for blood concentration of cadmium among persons aged 1 year and older was 1.3 µg/L. | In 2017 to 2018, the 95th percentile for urinary (creatinine corrected) concentration of nitrate among persons aged 6 years and older was 113.0 mg/g of creatinine. | In 2017 to 2018, the 95th percentile for blood concentration of serum perfluorooctanoic acid (PFOA) among persons aged 12 years and older was 3.8 ng/mL. |
| Healthy People 2030 Target | No Healthy People Target for this measure. | No Healthy People Target for this measure. | No Healthy People Target for this measure. | No Healthy People Target for this measure. | No Healthy People Target for this measure. |
| More Information | Arsenic | Benzene | Cadmium | Nitrate | Perfluoroalkyl and Polyfluoroalkyl Substances (PFAS) |
| Last Updated | March 2024 | March 2024 | March 2024 | March 2024 | March 2024 |